> For the complete documentation index, see [llms.txt](https://www.mlcompendium.com/llms.txt). Markdown versions of documentation pages are available by appending `.md` to page URLs; this page is available as [Markdown](https://www.mlcompendium.com/data/analytics-intro/dependence-and-selection.md).
# Dependence and Selection
Features that move together waste capacity, and features that do not predict the target waste the model, so this page is how to measure dependence and then select. It moves from correlation versus covariance, through correlation across feature types and visualizations, into mutual information, Cramer’s coefficient, predictive power score, feature selection, and feature importance.
#### **CORRELATION VS COVARIANCE**
Measuring dependence starts with choosing a scale. Correlation is between -1 to 1, covariance is -inf to inf, units in covariance affect the scale, so correlation is preferred, it is normalized. Correlation is a measure of association. Correlation is used for bivariate analysis. It is a measure of how well the two variables are related. Covariance is also a measure of association. Covariance is a measure of the relationship between two random variables. The article these notes came from no longer opens and is kept at the end of the page.
### **CORRELATION**
With correlation chosen as the scale, the standard coefficient is Pearson. MachineLearningMastery's "How to Calculate Correlation Between Variables in Python" covers [**Pearson**](https://machinelearningmastery.com/how-to-use-correlation-to-understand-the-relationship-between-variables/) in code.
#### **CORRELATION BETWEEN FEATURE TYPES**
Pearson assumes two numeric columns, and real tables mix categorical and continuous features, so the question widens. Association vs correlation - correlation is a measure of association and a yes no question without assuming linearity. [**A great article in medium**](https://medium.com/@outside2SDs/an-overview-of-correlation-measures-between-categorical-and-continuous-variables-4c7f85610365), covering just about everything with great detail and explaining all the methods plus references, is the place to start.
For a categorical feature against the target, one quick view is heat maps for categorical vs target - groupby count per class, normalize by total count to see if you get more grouping in a certain combination of cat/target than others.
For a continuous feature against a categorical one, the tools are [**Anova**](https://www.researchgate.net/post/Which_test_do_I_use_to_estimate_the_correlation_between_an_independent_categorical_variable_and_a_dependent_continuous_variable) / [**log regression**](https://www.statalist.org/forums/forum/general-stata-discussion/general/1470627-correlation-between-continous-and-categorical-variable), with more in [**2\*,**](https://dzone.com/articles/correlation-between-categorical-and-continuous-var-1) and the [**git**](https://github.com/ShitalKat/Correlation/blob/master/Correlation%20between%20categorical%20and%20continuous%20variables.ipynb) notebook, a python code and analysis on correlation measure between categorical and continuous variable. Source 3 no longer opens and is kept at the end of the page. The same question, for numeric/[**cont vs categorical**](https://www.quora.com/How-can-I-measure-the-correlation-between-continuous-and-categorical-variables), has one rule of thumb: a high F score from anova hints about association between a feature and a target, i.e., the importance of the feature to separating the target.
The same notes are in [Distribution Transformation](/data/processing-intro/distribution-transformation.md).
Since that rule leans on the F score, two videos explain ANOVA itself. J David Eisenberg's Analysis of Variance (ANOVA) is Anova youtube [**1**](https://www.youtube.com/watch?v=ITf4vHhyGpc), and statisticsfun's How To Calculate and Understand Analysis of Variance (ANOVA) F Test is [**2**](https://www.youtube.com/watch?v=-yQb_ZJnFXw). The figure below goes with the continuous-versus-categorical question.
Features.
The image is by multiple possible sources: [**rayhanul islam**](https://www.quora.com/How-can-I-measure-the-correlation-between-continuous-and-categorical-variables) on the same Quora question, and [**statistics for fun**](https://www.facebook.com/statneil/photos/a.787373884990868/839856346409288/?type=3).
The last pairing is categorical against categorical. Cat vs cat has many metrics - on medium; that article no longer opens and is kept at the end of the page.
#### **CORRELATION VISUALIZATION**
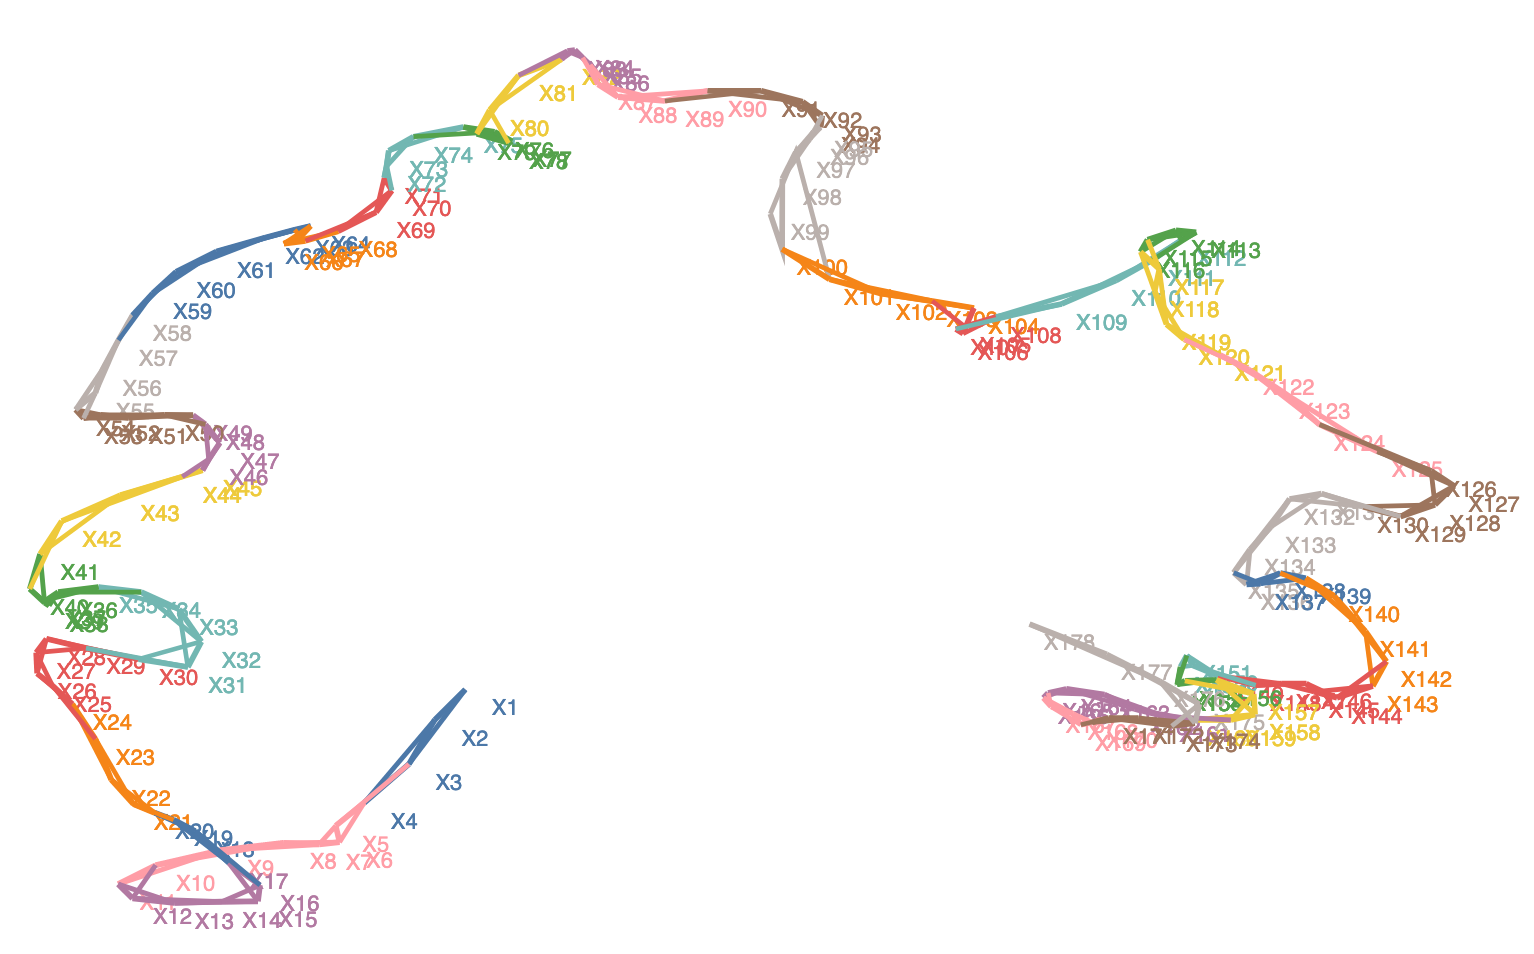
A table of coefficients is hard to read once there are many features, so the next step is to look at them. Feature space is that view, shown in the two figures below, both credited to Matt Britton; the original post's old address is kept at the end of the page.
Feature space.
Feature space.
### **MUTUAL INFORMATION COEFFICIENT**
Correlation and its pictures still look for a particular kind of relationship; mutual information asks whether two variables share any information at all.
The same notes are in [Information Theory](/data/analytics-intro/information-theory.md).
The starting point is the MIC [**Paper**](https://www.ncbi.nlm.nih.gov/pmc/articles/PMC3325791/) **- we present a measure of dependence for two-variable relationships: the maximal information coefficient (MIC). MIC captures a wide range of associations both functional and not, and for functional relationships provides a score that roughly equals the coefficient of determination (R2) of the data relative to the regression function.**\\
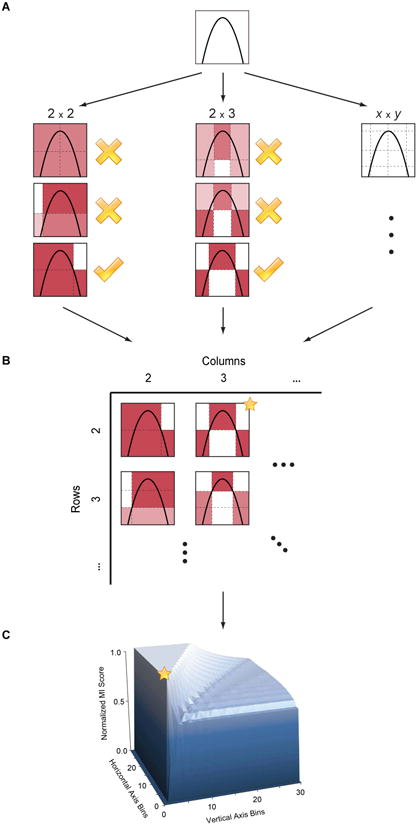
**Computing MIC** is a grid search over the scatter plot, shown in the figure and explained under it.\\
Features.
**(A) For each pair (x,y), the MIC algorithm finds the x-by-y grid with the highest induced mutual information. (B) The algorithm normalizes the mutual information scores and compiles a matrix that stores, for each resolution, the best grid at that resolution and its normalized score. (C) The normalized scores form the characteristic matrix, which can be visualized as a surface; MIC corresponds to the highest point on this surface.** \\
**In this example, there are many grids that achieve the highest score. The star in (B) marks a sample grid achieving this score, and the star in (C) marks that grid's corresponding location on the surface.**\\
MIC is a paper-level measure; for day-to-day feature scoring, scikit-learn has the estimators. The [**Mutual information classifier**](https://scikit-learn.org/stable/modules/generated/sklearn.feature_selection.mutual_info_classif.html) **- Estimate mutual information for a discrete target variable.**
**Mutual information (MI)** [**\[1\]**](https://scikit-learn.org/stable/modules/generated/sklearn.feature_selection.mutual_info_classif.html#r50b872b699c4-1) **between two random variables is a non-negative value, which measures the dependency between the variables. It is equal to zero if and only if two random variables are independent, and higher values mean higher dependency.**
**The function relies on nonparametric methods based on entropy estimation from k-nearest neighbors distances as described in** [**\[2\]**](https://scikit-learn.org/stable/modules/generated/sklearn.feature_selection.mutual_info_classif.html#r50b872b699c4-2) **and** [**\[3\]**](https://scikit-learn.org/stable/modules/generated/sklearn.feature_selection.mutual_info_classif.html#r50b872b699c4-3)**. Both methods are based on the idea originally proposed in** [**\[4\]**](https://scikit-learn.org/stable/modules/generated/sklearn.feature_selection.mutual_info_classif.html#r50b872b699c4-4)**.**\\
The same quantity also compares two labelings rather than a feature and a target. The [**MI score**](https://scikit-learn.org/stable/modules/generated/sklearn.metrics.mutual_info_score.html) **- Mutual Information between two clusterings.**
**The Mutual Information is a measure of the similarity between two labels of the same data.** \\
Raw MI rewards clusterings with more clusters, which is why two corrected versions follow. The [**Adjusted MI score**](https://scikit-learn.org/stable/modules/generated/sklearn.metrics.adjusted_mutual_info_score.html#sklearn.metrics.adjusted_mutual_info_score) **- Adjusted Mutual Information between two clusterings.**
**Adjusted Mutual Information (AMI) is an adjustment of the Mutual Information (MI) score to account for chance. It accounts for the fact that the MI is generally higher for two clusterings with a larger number of clusters, regardless of whether there is actually more information shared.**
**This metric is furthermore symmetric: switching label\_true with label\_pred will return the same score value. This can be useful to measure the agreement of two independent label assignments strategies on the same dataset when the real ground truth is not known**\\
The other correction rescales instead of adjusting for chance. The [**Normalized MI score**](https://scikit-learn.org/stable/modules/generated/sklearn.metrics.normalized_mutual_info_score.html#sklearn.metrics.normalized_mutual_info_score) **- Normalized Mutual Information (NMI) is a normalization of the Mutual Information (MI) score to scale the results between 0 (no mutual information) and 1 (perfect correlation). In this function, mutual information is normalized by some generalized mean of H(labels\_true) and H(labels\_pred)), defined by the average\_method.**\\
### **CRAMER’S COEFFICIENT**
Mutual information handles any pair of variables; for two categorical variables there is also a coefficient built for the job, the "cat vs cat" case from earlier. [**Calculating** ](https://stackoverflow.com/questions/20892799/using-pandas-calculate-cram%C3%A9rs-coefficient-matrix)it in pandas is the Stack Overflow question on a Cramér's coefficient matrix, asked about how closely the nation and language of Wikipedia articles correlate.
##
The empty heading above is a marker that separated sections in the original notes.
### **PREDICTIVE POWER SCORE (PPS)**
Every measure so far is symmetric or type-specific, and many real relationships have a correlation of 0. Florian Wetschoreck's "RIP correlation. Introducing the Predictive Power Score" proposes a score that [**Is an asymmetric, data-type-agnostic score for predictive relationships between two columns that ranges from 0 to 1.**](https://medium.com/data-science/rip-correlation-introducing-the-predictive-power-score-3d90808b9598) The implementation is on [**github**](https://github.com/8080labs/ppscore) as Predictive Power Score (PPS) in Python.
Predictive power score examples.
**Too many scenarios where the correlation is 0. This makes me wonder if I missed something… (Excerpt from the** [**image by Denis Boigelot**](https://en.wikipedia.org/wiki/Correlation_and_dependence)**)**\\
For both task types the score compares a model against a naive baseline and normalizes the result so it is never smaller than 0; only the metric changes.
**Regression**
**In case of an regression, the ppscore uses the mean absolute error (MAE) as the underlying evaluation metric (MAE\_model). The best possible score of the MAE is 0 and higher is worse. As a baseline score, we calculate the MAE of a naive model (MAE\_naive) that always predicts the median of the target column. The PPS is the result of the following normalization (and never smaller than 0):**\\
$$\text{PPS} = 1 - (\text{MAE}*{model} / \text{MAE}*{naive})$$\\
**Classification**
**If the task is a classification, we compute the weighted F1 score (wF1) as the underlying evaluation metric (F1\_model). The F1 score can be interpreted as a weighted average of the precision and recall, where an F1 score reaches its best value at 1 and worst score at 0. The relative contribution of precision and recall to the F1 score are equal. The weighted F1 takes into account the precision and recall of all classes weighted by their support as described** [**here**](https://scikit-learn.org/stable/modules/generated/sklearn.metrics.f1_score.html)**. As a baseline score (F1\_naive), we calculate the weighted F1 score for a model that always predicts the most common class of the target column (F1\_most\_common) and a model that predicts random values (F1\_random). F1\_naive is set to the maximum of F1\_most\_common and F1\_random. The PPS is the result of the following normalization (and never smaller than 0):**\\
$$\text{PPS} = (F1\_{model} - F1\_{naive}) / (1 - F1\_{naive})$$\\
### **FEATURE SELECTION**
Once dependence can be scored, the practical question is which features to keep.
The same notes are in [Interpretable & Explainable AI (XAI)](/responsible-ai/interpretable-and-explainable-ai-xai.md) and [L1 and L2](/predictive-ml/regularization.md#l1-and-l2).
What follows is a series of good articles that explain about several techniques for feature selection, from a first overview through classic methods to the Relief family.
The overview comes first. A great notebook about feature correlation and manytypes of visualization, what to drop what to keep, using many feature reduction and selection methods (quite a lot actually). Its a really good intro: . When selection is slow, [**How to parallelize feature selection on several CPUs,**](https://stackoverflow.com/questions/37037450/multi-label-feature-selection-using-sklearn) do it per label on each cpu and average the results.
Text is a common first use. [**Multi class classification, feature selection, model selection, co-feature analysis**](https://medium.com/data-science/multi-class-text-classification-with-scikit-learn-12f1e60e0a9f) is a scikit-learn text classification walkthrough for cases like tagging news by topic or products by category. [**Text analysis for sentiment, doing feature selection**](https://streamhacker.com/tag/chi-square/) is a tutorial with chi2(IG?), and StreamHacker's Text Classification for Sentiment Analysis – Stopwords and Collocations is the [**part 2 with bi-gram collocation in ntlk**](https://streamhacker.com/2010/05/24/text-classification-sentiment-analysis-stopwords-collocations/). What is collocation? - “the habitual juxtaposition of a particular word with another word or words with a frequency greater than chance.”
For the classic methods, Data Talks' Feature Selection for Scikit Learn covers [**Sklearn feature selection methods (4) - youtube**](https://www.youtube.com/watch?v=wjKvyk8xStg). The Diving into data series walks them in order: [**Univariate**](http://blog.datadive.net/selecting-good-features-part-i-univariate-selection/) selection in part I, [**Linear models and regularization,**](http://blog.datadive.net/selecting-good-features-part-ii-linear-models-and-regularization/) in part II, [**Random forests and feature ranking**](http://blog.datadive.net/selecting-good-features-part-iii-random-forests/) in part III, and [**Stability selection and recursive feature elimination (RFE).**](http://blog.datadive.net/selecting-good-features-part-iv-stability-selection-rfe-and-everything-side-by-side/) side by side in part IV. The random forest part pairs with a tuning note, [**Random Search for focus and only then grid search for Random Forest**](https://medium.com/data-science/hyperparameter-tuning-the-random-forest-in-python-using-scikit-learn-28d2aa77dd74), with the matching Improving Random Forest Part 2 notebook from WillKoehrsen/Machine-Learning-Projects as [**code**](https://github.com/WillKoehrsen/Machine-Learning-Projects/blob/master/random_forest_explained/Improving%20Random%20Forest%20Part%202.ipynb). These selectors are wrapper methods in sklearn for the purpose of feature selection; see [**RFE in sklearn**](http://scikit-learn.org/stable/modules/generated/sklearn.feature_selection.RFE.html). A kernel-based alternative is C.K. Wolfe's [**Kernel feature selection via conditional covariance minimization**](http://bair.berkeley.edu/blog/2018/01/23/kernels/).
Several sources package the checks into one place. The [**Github class that does the following**](https://medium.com/data-science/a-feature-selection-tool-for-machine-learning-in-python-b64dd23710f0) finds:
* **Features with a high percentage of missing values**
* **Collinear (highly correlated) features**
* **Features with zero importance in a tree-based model**
* **Features with low importance**
* **Features with a single unique value**
MachineLearningMastery's Feature Selection For Machine Learning in Python, the [**Machinelearning mastery on FS**](https://machinelearningmastery.com/feature-selection-machine-learning-python/), covers four methods:
* **Univariate Selection.**
* **Recursive Feature Elimination.**
* **Principle Component Analysis.**
* **Feature Importance.**
The classes in the sklearn.feature\_selection module can be used for feature selection or dimensionality reduction on sample sets, either to improve estimators’ accuracy scores or to boost their performance. The [**Sklearn tutorial on FS:**](http://scikit-learn.org/stable/modules/feature_selection.html) lists:
* **Low variance**
* **Univariate kbest**
* **RFE**
* **selectFromModel using \_coef \_important\_features**
* **Linear models with L1 (svm recommended L2)**
* **Tree based importance**
[**A complete overview of many methods**](https://www.analyticsvidhya.com/blog/2016/12/introduction-to-feature-selection-methods-with-an-example-or-how-to-select-the-right-variables/) is an introduction to feature selection methods with an example, and it separates reduction, filter selection, and wrapper methods:
* **(reduction) LDA: Linear discriminant analysis is used to find a linear combination of features that characterizes or separates two or more classes (or levels) of a categorical variable.**
* **(selection) ANOVA: ANOVA stands for Analysis of variance. It is similar to LDA except for the fact that it is operated using one or more categorical independent features and one continuous dependent feature. It provides a statistical test of whether the means of several groups are equal or not.**
The same notes are in [Distribution Transformation](/data/processing-intro/distribution-transformation.md).
* **(Selection) Chi-Square: It is a is a statistical test applied to the groups of categorical features to evaluate the likelihood of correlation or association between them using their frequency distribution.**
* **Wrapper methods:**
* **Forward Selection: Forward selection is an iterative method in which we start with having no feature in the model. In each iteration, we keep adding the feature which best improves our model till an addition of a new variable does not improve the performance of the model.**
* **Backward Elimination: In backward elimination, we start with all the features and removes the least significant feature at each iteration which improves the performance of the model. We repeat this until no improvement is observed on removal of features.**
* **Recursive Feature elimination: It is a greedy optimization algorithm which aims to find the best performing feature subset. It repeatedly creates models and keeps aside the best or the worst performing feature at each iteration. It constructs the next model with the left features until all the features are exhausted. It then ranks the features based on the order of their elimination.**
Wrapper methods retrain the model many times; Relief scores features from distances instead. Yash Dagli's [**Relief**](https://medium.com/@yashdagli98/feature-selection-using-relief-algorithms-with-python-example-3c2006e18f83) article, with implementations in [**GIT**](https://github.com/GrantRVD/ReliefF) and [**git2**](https://pypi.org/project/ReliefF/#description), describes a new family of feature selection trying to optimize the distance of two samples from the selected one, one which should be closer the other farther. The weight update is quoted from that article:
**“The weight updation of attributes works on a simple idea (line 6). That if instance Rᵢ and H have different value (i.e the diff value is large), that means that attribute separates two instance with the same class which is not desirable, thus we reduce the attributes weight. On the other hand, if the instance Rᵢ and M have different value, that means the attribute separates the two instance with different class, which is desirable.”**
Relief also ships in larger libraries. [**Scikit-feature (includes relief)**](https://github.com/chappers/scikit-feature) is feature selection with scikit-learn, forked from [**this**](https://github.com/jundongl/scikit-feature/tree/master/skfeature) open-source feature selection repository in python, whose [**(docs)**](http://featureselection.asu.edu/algorithms.php) page is linked beside it. [**Scikit-rebate (based on relief)**](https://github.com/EpistasisLab/scikit-rebate) is a scikit-learn-compatible Python implementation of ReBATE, a suite of Relief-based feature selection algorithms.
Selection can also go back to the information measures from earlier on the page. [**Feature selection using entropy, information gain, mutual information and … in sklearn.**](https://gist.github.com/GaelVaroquaux/ead9898bd3c973c40429) is a gist for estimating entropy and mutual information with scikit-learn, and the theory behind it is in [**Entropy, mutual information and KL Divergence by AurelienGeron**](https://www.techleer.com/articles/496-a-short-introduction-to-entropy-cross-entropy-and-kl-divergence-aurelien-geron/).
### **FEATURE IMPORTANCE**
Selection decides which features stay; importance asks how much each kept feature actually drives the prediction.
The same notes are in [Lime](/responsible-ai/interpretable-and-explainable-ai-xai.md#lime) and [Shap](/responsible-ai/interpretable-and-explainable-ai-xai.md#shap).
Note: the point about lime below is used for explainability, please also check that topic.
The first read is Eryk Lewinson's Explaining Feature Importance by example of a Random Forest, [**Using RF and other methods, really good**](https://medium.com/data-science/explaining-feature-importance-by-example-of-a-random-forest-d9166011959e). Rankings are not the same as measured impact, which is the point of [**Non parametric feature impact and importance**](https://arxiv.org/abs/2006.04750) **- while there are nonparametric feature selection algorithms, they typically provide feature rankings, rather than measures of impact or importance.In this paper, we give mathematical definitions of feature impact and importance, derived from partial dependence curves, that operate directly on the data.**
LIME goes one step further and explains single predictions. The "Why Should I Trust You?" [**Paper**](https://arxiv.org/abs/1602.04938) **(**[**pdf**](https://arxiv.org/pdf/1602.04938.pdf)**,** [**blog post**](https://www.oreilly.com/learning/introduction-to-local-interpretable-model-agnostic-explanations-lime)**): (**[**GITHUB**](https://github.com/marcotcr/lime/blob/master/README.md)**) how to "explain the predictions of any classifier in an interpretable and faithful manner, by learning an interpretable model locally around the prediction."**\
\
**they want to understand the reasons behind the predictions, it’s a new field that says that many 'feature importance' measures shouldn’t be used. i.e., in a linear regression model, a feature can have an importance rank of 50 (for example), in a comparative model where you duplicate that feature 50 times, each one will have 1/50 importance and won’t be selected for the top K, but it will still be one of the most important features. so new methods needs to be developed to understand feature importance. this one has git code as well.**
To try it, there are **Several github notebook examples:** [**binary case**](https://marcotcr.github.io/lime/tutorials/Lime%20-%20basic%20usage%2C%20two%20class%20case.html)**,** [**multi class**](https://marcotcr.github.io/lime/tutorials/Lime%20-%20multiclass.html)**,** [**cont and cat features**](https://marcotcr.github.io/lime/tutorials/Tutorial%20-%20continuous%20and%20categorical%20features.html)**, there are many more for images in the github link.**\\
The authors' own description of the idea, and the figure it refers to, close the page:
**“Intuitively, an explanation is a local linear approximation of the model's behaviour. While the model may be very complex globally, it is easier to approximate it around the vicinity of a particular instance. While treating the model as a black box, we perturb the instance we want to explain and learn a sparse linear model around it, as an explanation. The figure below illustrates the intuition for this procedure. The model's decision function is represented by the blue/pink background, and is clearly nonlinear. The bright red cross is the instance being explained (let's call it X). We sample instances around X, and weight them according to their proximity to X (weight here is indicated by size). We then learn a linear model (dashed line) that approximates the model well in the vicinity of X, but not necessarily globally. For more information, read our paper, or take a look at this blog post.”**\
\\
Features.
## Deprecated links
{% hint style="warning" %}
These links and images no longer work. The original wording is kept here. A same-resource copy, when one was checked, is used above.
{% endhint %}
\- Correlation is between -1 to 1, covariance is -inf to inf, units in covariance affect the scale, so correlation is preferred, it is normalized.. This address no longer opens: - Feature space. This address no longer opens: - Cat vs cat\*\*, many metrics - on medium\*\*. This address no longer opens: - 3. This address no longer opens: - Github class that does the following. This address no longer opens:
---
# Agent Instructions
This documentation is published with GitBook. GitBook is the documentation platform designed so that both humans and AI agents can read, navigate, and reason over technical content effectively. Learn more at gitbook.com.
## Querying This Documentation
If you need additional information that is not directly available in this page, you can query the documentation by asking a question.
Perform an HTTP GET request on the following URL with the `ask` and `goal` query parameters:
```
GET https://www.mlcompendium.com/data/analytics-intro/dependence-and-selection.md?ask=&goal=
```
`ask` is the immediate question: it should be specific, self-contained, and written in natural language.
`goal` is what the user is ultimately trying to achieve, the reason they need the answer. Sharing it helps GitBook give you a better, more relevant answer. A goal is most helpful when it describes the outcome the user wants rather than restating the question. For example, with `ask=how do I create an API token`, a goal like `automate deployments from our CI pipeline` lets GitBook tailor the answer to that use case.
The response will contain a direct answer to the question and relevant excerpts and sources from the documentation.
Use this mechanism when the answer is not explicitly present in the current page, you need clarification or additional context, or you want to retrieve related documentation sections.