> For the complete documentation index, see [llms.txt](https://www.mlcompendium.com/llms.txt). Markdown versions of documentation pages are available by appending `.md` to page URLs; this page is available as [Markdown](https://www.mlcompendium.com/data/processing-intro/distribution-transformation.md).
# Distribution Transformation
Skewed data breaks tests that assume a normal shape, so the work here is to transform the column and then check whether normality actually arrived. Box-Cox is the main transform on this page; guaranteed normality is the honest answer, then the null-hypothesis tests and the Mann-Whitney U test that do not need normality. The same notes are in [CORRELATION](/data/analytics-intro/dependence-and-selection.md#correlation), [Distribution](/data/analytics-intro/distribution.md), and [FEATURE SELECTION](/data/analytics-intro/dependence-and-selection.md#feature-selection).
The usual fixes for a skewed column are few, and the [Top 3 methods for handling skewed data](https://medium.com/data-science/top-3-methods-for-handling-skewed-data-1334e0debf45) are log, square root, and box cox transformations. The last of these gets the rest of the page.
## Box Cox
Of those three, Box-Cox is the one that picks its own exponent. The same notes are in [FEATURE ENGINEERING](/data/processing-intro/feature-engineering.md#feature-engineering).
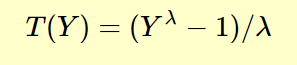
Jason Brownlee's [Power transformations](https://machinelearningmastery.com/power-transforms-with-scikit-learn/) post starts from the same problem: algorithms like Linear Regression and Gaussian Naive Bayes assume numerical variables have a Gaussian distribution, while real data may be nearly Gaussian with outliers or a skew, or a totally different distribution such as exponential. So what is the Box-Cox Power Transformation? It is a procedure to identify an appropriate exponent (Lambda = l) to use to transform data into a “normal shape.” The Lambda value indicates the power to which all data should be raised.
Box-Cox power transformation.
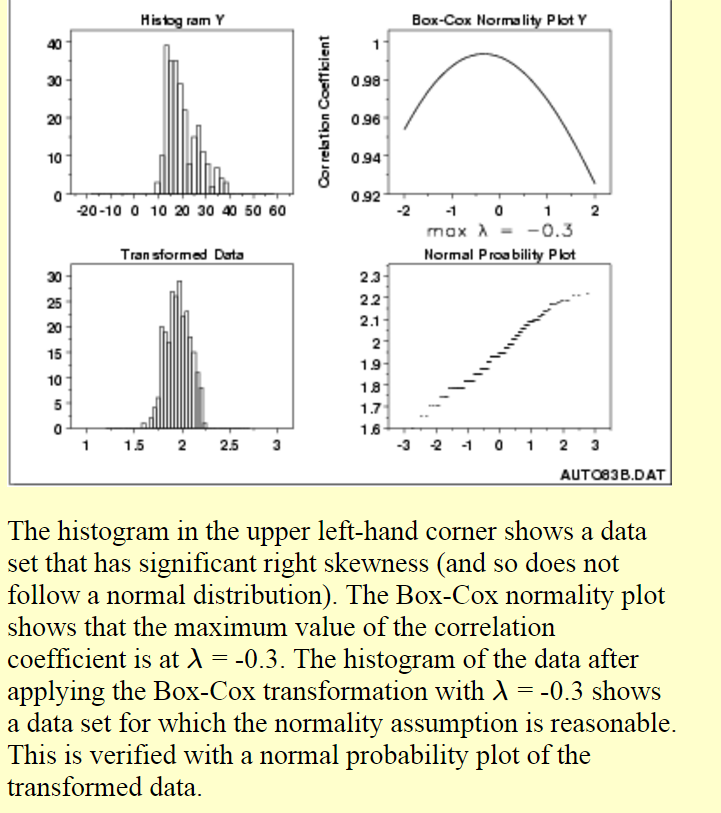
The NIST handbook's Box-Cox Normality Plot page explains why that matters, and opens with [The Box-Cox transformation is a useful family of transformations.](http://www.itl.nist.gov/div898/handbook/eda/section3/eda336.htm) Many statistical tests and intervals are based on the assumption of normality. The assumption of normality often leads to tests that are simple, mathematically tractable, and powerful compared to tests that do not make the normality assumption. Unfortunately, many real data sets are in fact not approximately normal. However, an appropriate transformation of a data set can often yield a data set that does follow approximately a normal distribution, which increases the applicability and usefulness of statistical techniques based on the normality assumption.
An appropriate transformation can yield an approximately normal distribution.
IMPORTANT:!! After a transformation (c), we need to measure the normality of the resulting transformation (d). One measure is to compute the correlation coefficient of a [normal probability plot](http://www.itl.nist.gov/div898/handbook/eda/section3/normprpl.htm) => (d). The correlation is computed between the vertical and horizontal axis variables of the probability plot and is a convenient measure of the linearity of the probability plot. In other words: the more linear the probability plot, the better a normal distribution fits the data!
Minitab's guest post, How Could You Benefit from a Box-Cox Transformation?, is the [\*NOTE: another useful link that explains it with figures, but i did not read it.](http://blog.minitab.com/blog/applying-statistics-in-quality-projects/how-could-you-benefit-from-a-box-cox-transformation)
## Guaranteed normality?
That normality check is not optional, because Box-Cox does not guarantee a normal result. The answer is NO! This is because it actually does not really check for normality; the method checks for the smallest standard deviation. The assumption is that among all transformations with Lambda values between -5 and +5, transformed data has the highest likelihood – but not a guarantee – to be normally distributed when standard deviation is the smallest. It is absolutely necessary to always check the transformed data for normality using a probability plot. (d)
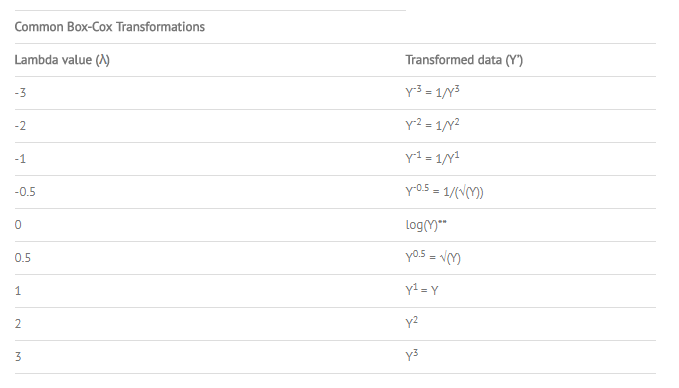
Additionally, the Box-Cox Power transformation only works if all the data is positive and greater than 0. This is achieved easily by adding a constant ‘c’ to all data such that it all becomes positive before it is transformed. The transformation equation is then given by the Statistics How To definition page, [COMMON TRANS: FORMULAS (based on the actual formula)](http://www.statisticshowto.com/box-cox-transformation/), shown in the figure below.
Common transformation formulas.
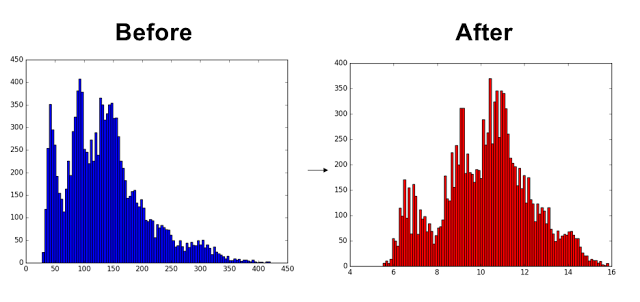
Finally: An awesome tutorial (dead) used to explain this, and a replacement is kept at the end of the page. In python there are [code examples](https://github.com/kentmacdonald2/Box-Cox-Transformation-Python-Example), the companion code from the Box-Cox transformation tutorial on kmdatascience.com, and there is also another code example [here](https://stackoverflow.com/questions/33944129/python-library-for-data-scaling-centering-and-box-cox-transformation), the Stack Overflow question asking for a Python package that does scaling, centering, and Box-Cox to eliminate skewness, the way R's caret package does. The quote below explains what that function call returns:
> “Simply pass a 1-D array into the function and it will return the Box-Cox transformed array and the optimal value for lambda. You can also specify a number, alpha, which calculates the confidence interval for that value. (For example, alpha = 0.05 gives the 95% confidence interval).”
Box-Cox transformed array and lambda.
Maybe there is a slight problem in the python vs R code; the details here are kept at the end of the page, but it needs investigating.
## Null hypothesis
When normality cannot be guaranteed, the result still has to be tested against a null hypothesis. The same notes are in [Hypothesis Testing](/decision-intelligence/hypothesis-testing.md).
A note on chi-square, the null hypothesis, and observed versus expected counts used to sit here; that address no longer opens and is kept at the end of the page.
Analytics vidhya covers the rest of the path. [What is hypothesis testing](https://www.analyticsvidhya.com/blog/2015/09/hypothesis-testing-explained/) is Sunil Ray's guide: hypothesis testing is a data analysis technique used to make inferences about the sample data from a larger population. [Intro to t-tests analytics vidhya](https://www.analyticsvidhya.com/blog/2019/05/statistics-t-test-introduction-r-implementation/?utm_source=facebook.com\&utm_medium=social) teaches T-Tests, their types, uses, and formulas with R examples, and how they differ from ANOVA and when to perform them. [Anova analysis of variance](https://www.analyticsvidhya.com/blog/2018/01/anova-analysis-of-variance/?utm_source=facebook.com\&utm_medium=social) is Gurchetan's ANOVA basics: concepts, Excel usage, key terms, group variability, One-Way & Two-Way ANOVA, F-Statistic, and MANOVA explained with steps & examples.
The ANOVA piece answers whether the means of two or more groups are significantly different from each other. ANOVA checks the impact of one or more factors by comparing the means of different samples. A one-way ANOVA tells us that at least two groups are different from each other, but it won’t tell us which groups are different. When the outcome or dependent variable (in our case the test scores) is affected by two independent variables/factors, we use a slightly modified technique called two-way ANOVA. The multivariate case, and the technique we will use to solve it, is known as MANOVA.
The Box-Cox tutorial that was once marked as a tutorial (dead) is live again as Box Cox Transformations in Python, which starts from the point that many common machine learning algorithms assume data is normally distributed and asks what to do when it isn't:
## Mann-Whitney U test
If the data will not become normal at all, the test itself has to drop the assumption. The same notes are in [Hypothesis Testing](/decision-intelligence/hypothesis-testing.md).
The Wikipedia entry ([what is?](https://en.wikipedia.org/wiki/Mann%E2%80%93Whitney_U_test)) defines it: the Mann–Whitney U test is a [nonparametric](https://en.wikipedia.org/wiki/Nonparametric_statistics) [test](https://en.wikipedia.org/wiki/Statistical_hypothesis_test) of the [null hypothesis](https://en.wikipedia.org/wiki/Null_hypothesis) that it is equally likely that a randomly selected value from one sample will be less than or greater than a randomly selected value from a second sample.
In other words: This test can be used to determine whether two independent samples were selected from populations having the same distribution.
Unlike the [t-test](https://en.wikipedia.org/wiki/T-test) it does not require the assumption of [normal distributions](https://en.wikipedia.org/wiki/Normal_distribution). It is nearly as efficient as the t-test on normal distributions.
## Deprecated links
{% hint style="warning" %}
These links and images no longer work. The original wording is kept here. A same-resource copy, when one was checked, is used above.
{% endhint %}
* here is a new one. This address no longer opens:
* details here. This address no longer opens:
* What is chi-square and what is a null hypothesis, and how do we calculate observed vs expected and check if we can reject the null and get significant difference. This address no longer opens:
---
# Agent Instructions
This documentation is published with GitBook. GitBook is the documentation platform designed so that both humans and AI agents can read, navigate, and reason over technical content effectively. Learn more at gitbook.com.
## Querying This Documentation
If you need additional information that is not directly available in this page, you can query the documentation by asking a question.
Perform an HTTP GET request on the following URL with the `ask` and `goal` query parameters:
```
GET https://www.mlcompendium.com/data/processing-intro/distribution-transformation.md?ask=&goal=
```
`ask` is the immediate question: it should be specific, self-contained, and written in natural language.
`goal` is what the user is ultimately trying to achieve, the reason they need the answer. Sharing it helps GitBook give you a better, more relevant answer. A goal is most helpful when it describes the outcome the user wants rather than restating the question. For example, with `ask=how do I create an API token`, a goal like `automate deployments from our CI pipeline` lets GitBook tailor the answer to that use case.
The response will contain a direct answer to the question and relevant excerpts and sources from the documentation.
Use this mechanism when the answer is not explicitly present in the current page, you need clarification or additional context, or you want to retrieve related documentation sections.