> For the complete documentation index, see [llms.txt](https://www.mlcompendium.com/llms.txt). Markdown versions of documentation pages are available by appending `.md` to page URLs; this page is available as [Markdown](https://www.mlcompendium.com/predictive-ml/dimensionality-reduction-methods.md).
# Dimensionality Reduction Methods
High-dimensional data has to be projected down before it can be plotted, clustered, or fed to a smaller model, and each projection keeps something different. The page opens with overviews and the question of what is lost, then walks the linear methods (PCA, SVD, kernel PCA, LDA, KDA, ICA, LSA), moves to manifold methods such as t-SNE and IVIS, and ends with a note on principal component regression versus partial least squares.
The overviews that used to open this page, A series on DR for dummies on medium part 1 2 3, A small blog post about PCA, AE & TSNE in tensorflow, and Visualizing PCA/TSNE using plots, no longer open and are kept at the end of the page. The figure below is the overview picture that remains.
Figure.
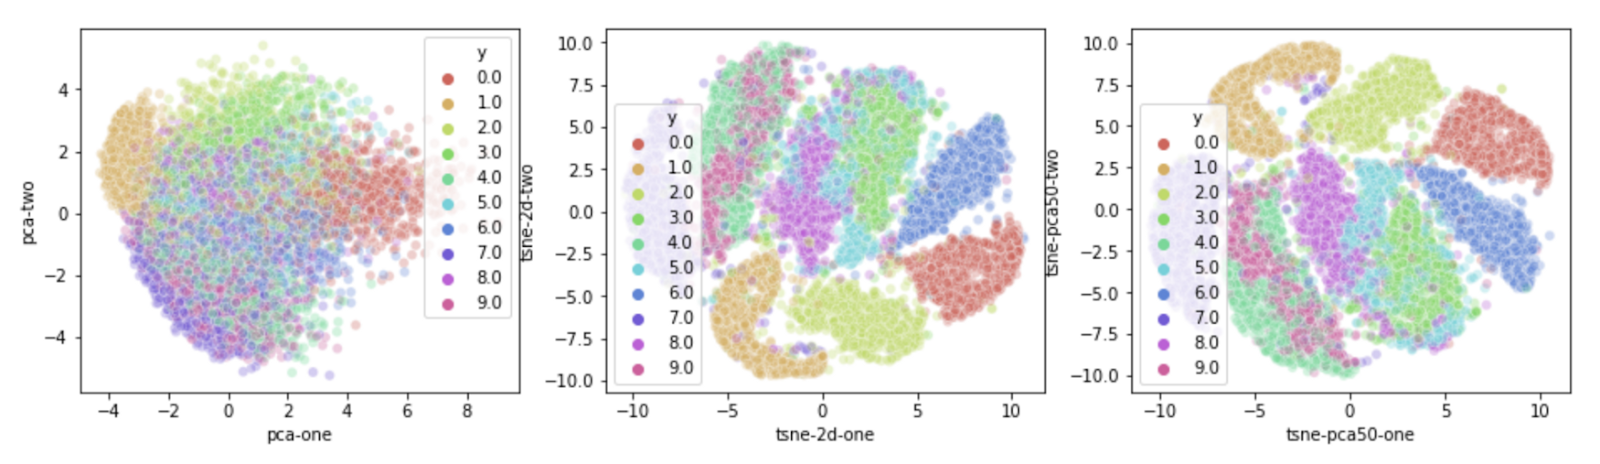
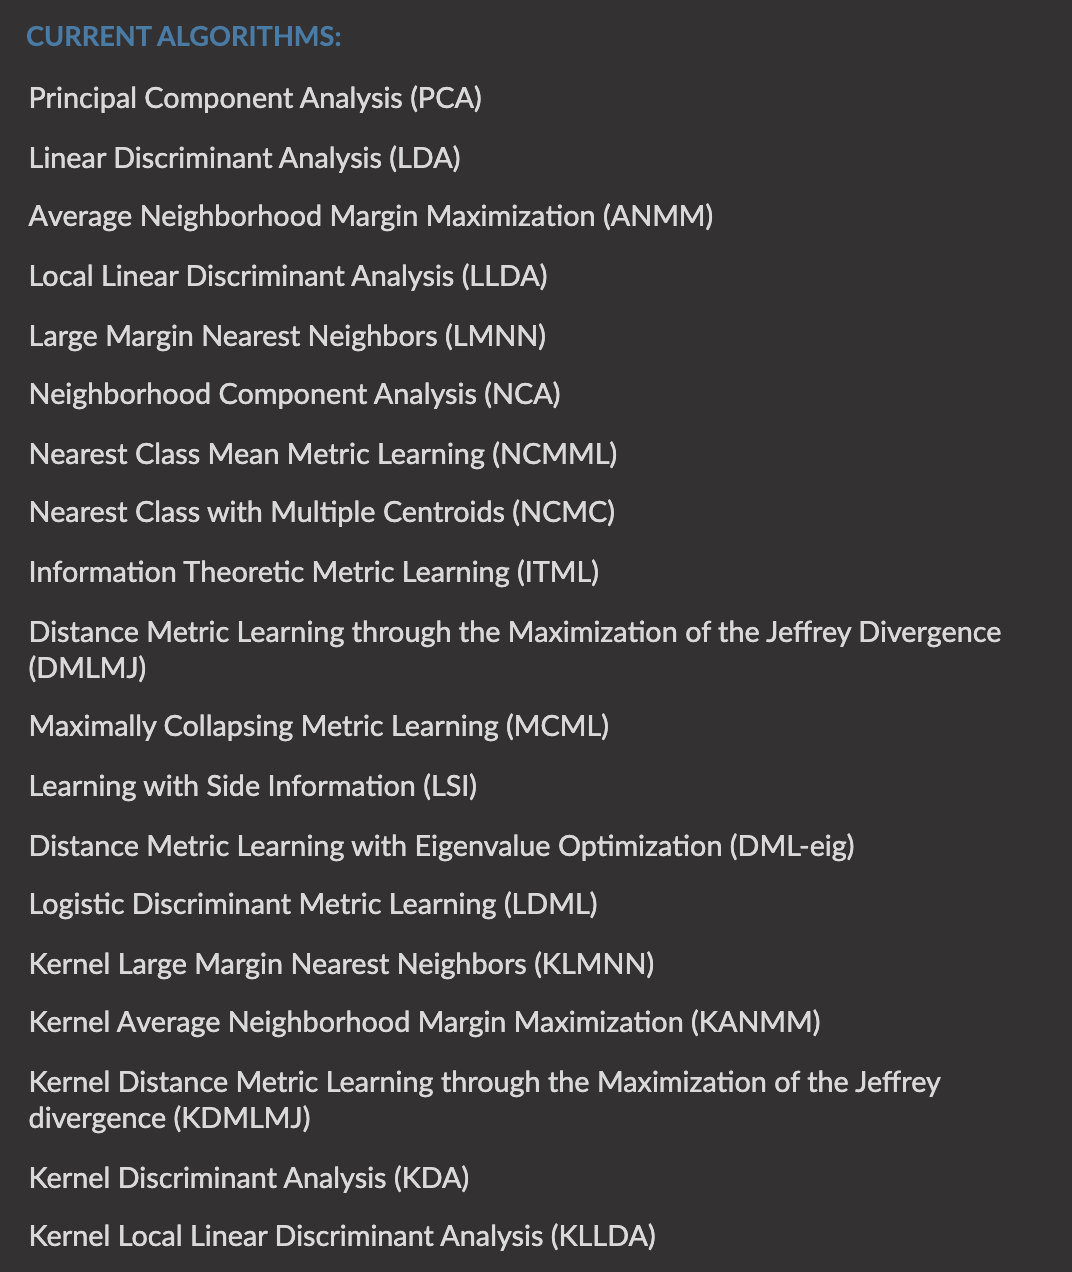
Once data is projected, you want to look at it. [Parallex by uber for tsne \ pca visualization](https://github.com/uber-research/parallax) is Uber Research's tool for interactive embeddings visualization, the place to see what tsne / ae / pca did to the data. The next question is what the projection threw away: [Does dim-reduction loses information - yes and no, in pca yes only if you use less than the entire matrix](https://stats.stackexchange.com/questions/66060/does-dimension-reduction-always-lose-some-information) is the question of whether dimension reduction always loses information, for example whether very sparse data might have a better encoding where nothing is lost. And when speed matters, [Performance comparison between dim-reduction implementations, tsne etc.](https://umap-learn.readthedocs.io/en/latest/benchmarking.html) is the benchmark that goes with the figure below.
Figure.
### PCA
PCA is where every linear method starts, so its math comes first, then scaling it up, then using it correctly. The same notes are in [DIMENSIONALITY REDUCTION](#dimensionality-reduction) and [PCA for log anomaly detection](/predictive-ml/templatization.md#pca-for-log-anomaly-detection).
The Machine learning mastery sequence builds it from the ground up. [Expected value, variance, covariance ](https://machinelearningmastery.com/introduction-to-expected-value-variance-and-covariance)is the gentle NumPy introduction to those fundamental statistics, useful for a better understanding of your data. [PCA](https://machinelearningmastery.com/calculate-principal-component-analysis-scratch-python/) is the from-scratch calculation: **(remove the mean from A, calculate cov(A), calculate eig(cov), A\*eigK = PCA)**. [EigenDecomposition](https://machinelearningmastery.com/introduction-to-eigendecomposition-eigenvalues-and-eigenvectors/) explains **what is an eigen vector - simply put its a vector that satisfies A\*v = lambda\*v, how to use eig() and how to confirm an eigenvector/eigenvalue and reconstruct the original A matrix.** [SVD](https://machinelearningmastery.com/singular-value-decomposition-for-machine-learning) is how to calculate the SVD from scratch with Python, matrix decomposition (matrix factorization) as describing a matrix by its constituent elements. What is missing is how the EigenDecomposition is calculated.
The from-scratch version does not fit a very large matrix. [PCA on large matrices!](https://amedee.me/post/pca-large-matrices/) argues you don't need Spark: it starts from a PCA of a matrix with 1 million rows and 13,000 columns that took 27 hours on a Spark cluster with a 16 core machine and 30GB of RAM, and shows that PCA on several billion element matrices can be done much faster. The two tricks are Randomized svd and Incremental svd.
With the mechanics in hand, the tutorials show the whole flow. [PCA on Iris](http://sebastianraschka.com/Articles/2015_pca_in_3_steps.html) is Sebastian Raschka's step-by-step tutorial through standardization, covariance matrices, eigendecomposition, explained variance, and projection, with Python code. Three background reads are marked (did not read): [What is PCA?](https://stats.stackexchange.com/questions/222/what-are-principal-component-scores) asks what principal component scores are, [What is a covariance matrix?](https://en.wikipedia.org/wiki/Covariance_matrix) is the Wikipedia covariance matrix article, and [Variance covariance matrix](http://stattrek.com/matrix-algebra/covariance-matrix.aspx) shows how to use matrix methods to generate a variance-covariance matrix from a matrix of raw data, with a sample problem and solution. [Visualization of the first PCA vectors](https://medium.com/@rtjeannier/using-pca-to-visualize-high-dimensional-data-6ff028c911c5) plots the first vectors, though it is unclear what he is trying to show. [A very nice introductory tutorial on how to use PCA](https://www.analyticsvidhya.com/blog/2016/03/practical-guide-principal-component-analysis-python/) is Himanshi Singh's guide to how PCA helps with large, correlated datasets in data science projects.
For the full theory, **\*\*** An in-depth tutorial on PCA (paper) is kept at the end of the page, and the tutorial paper that remains is linked twice: **\*\*** [yet another tutorial paper on PCA (looks good)](https://www.researchgate.net/publication/309165405_Principal_component_analysis_-_a_tutorial), also noted as [Another tutorial paper - looks decent](https://www.researchgate.net/publication/309165405_Principal_component_analysis_-_a_tutorial). In a real pipeline, [How to use PCA in Cross validation and for train\test split](https://stats.stackexchange.com/questions/114560/pca-on-train-and-test-datasets-do-i-need-to-merge-them) settles where PCA is fitted (bottom line, do it on the train only.)
PCA also leads straight to whitening. [PCA whitening](http://mccormickml.com/2014/06/03/deep-learning-tutorial-pca-and-whitening/) is the deep learning tutorial on PCA and whitening, and the [Stanford tutorial](http://ufldl.stanford.edu/tutorial/unsupervised/PCAWhitening/) is the same topic in the Unsupervised Feature Learning and Deep Learning Tutorial. For (pca/zca whitening), [Stackoverflow (really good)](https://stats.stackexchange.com/questions/117427/what-is-the-difference-between-zca-whitening-and-pca-whitening/117459) is RockTheStar's question on the difference between ZCA whitening and normal PCA whitening (dividing principal components by the square roots of the PCA eigenvalues), where ZCA whitening is PCA whitening multiplied by the PCA eigenvectors, and what ZCA is used for.
There are two things we are trying to accomplish with whitening:
1. Make the features less correlated with one another.
2. Give all of the features the same variance.
Whitening has two simple steps:
1. Project the dataset onto the eigenvectors. This rotates the dataset so that there is no correlation between the components.
2. Normalize the the dataset to have a variance of 1 for all components. This is done by simply dividing each component by the square root of its eigenvalue.
### SVD
SVD is the decomposition under PCA, and it gets its own entry because it shows up again in recommenders. The same notes are in [Recommender Systems](/ai-product/recommender-systems.md).
An explanation about SVD’s formulas used to sit here; it is kept at the end of the page.
### KPCA
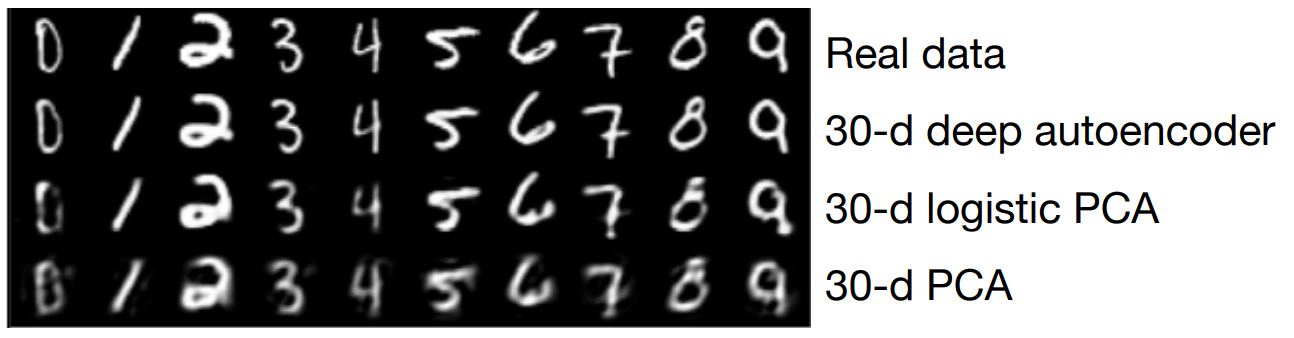
PCA is linear, so the next step is what happens when the structure is not. The slides behind this section (First they say that, kept at the end of the page) run in three steps. First they say that Autoencoder is PCA based on their equation, i.e. minimize the reconstruction error formula.
Figure.
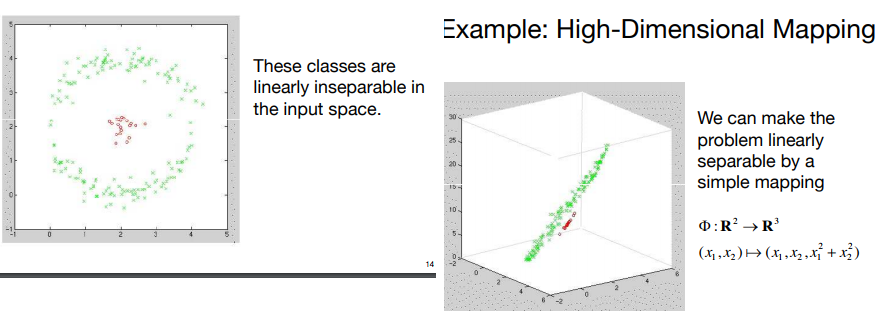
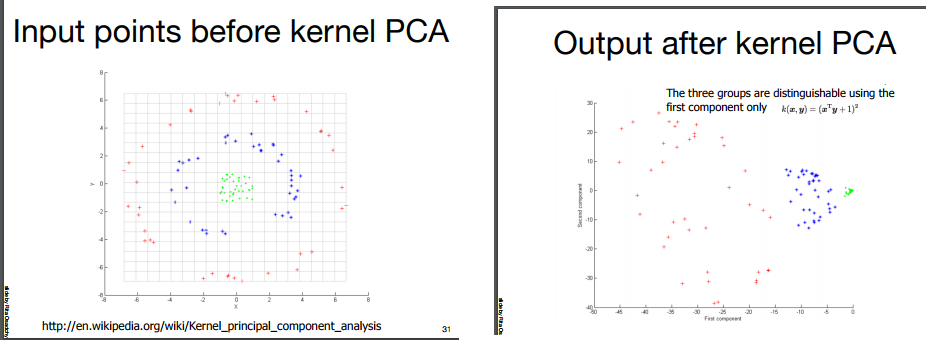
Then they say that PCA cant separate certain non-linear situations (circle within a circle), therefore they introduce kernel based PCA (using the kernel trick - like svm) which mapps the space to another linearly separable space, and performs PCA on it.
Figure.
Figure.
Finally, they show results of how KPCA works well on noisy images, compared to PCA.
Figure.
### LDA - Linear discriminant analysis
PCA and KPCA ignore labels. When labels exist, LDA uses them, which makes it supervised dimensionality reduction. The same notes are in [Normalization & Scaling](/data/processing-intro/normalization-and-scaling.md).
[A comparison / tutorial with code on pca vs lda - read!](http://rstudio-pubs-static.s3.amazonaws.com/84669_cd15214061d44e1493ffee69c5d55925.html) is Zhao Hao's "How to properly perform LDA". A comprehensive tutorial on LDA - read! is kept at the end of the page. Dim reduction with LDA - nice examples.
([Not to be confused with the other LDA](http://sebastianraschka.com/Articles/2014_python_lda.html)) - Linear Discriminant Analysis (LDA) is most commonly used as dimensionality reduction technique in the pre-processing step for pattern-classification and machine learning applications. The goal is to project a dataset onto a lower-dimensional space with good class-separability in order avoid overfitting (“curse of dimensionality”) and also reduce computational costs.
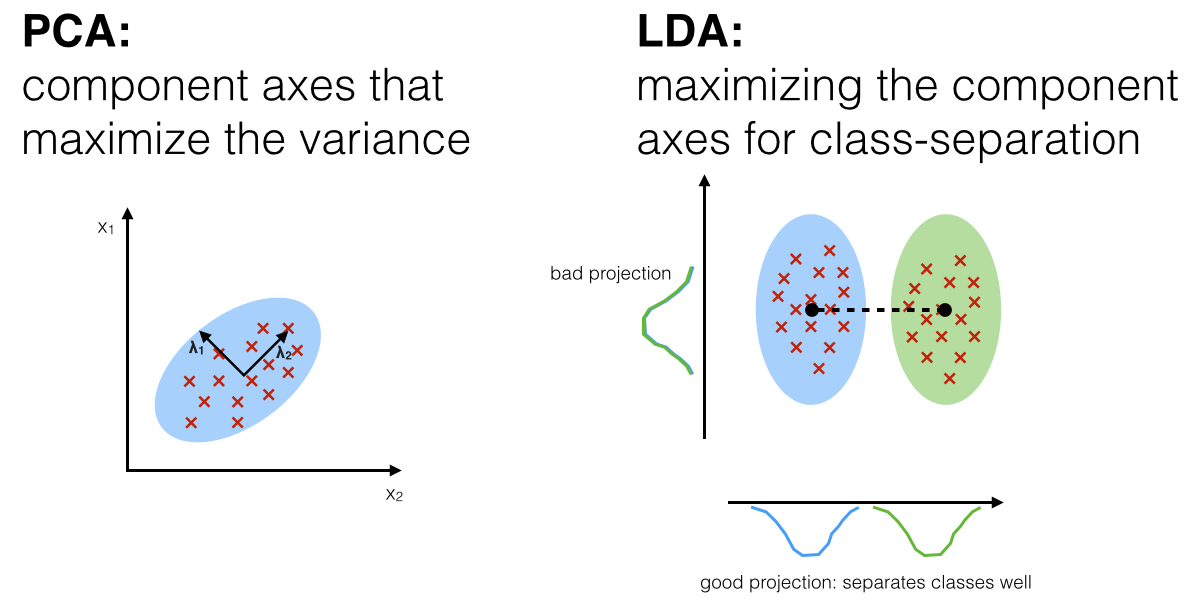
PCA vs LDA:
Both Linear Discriminant Analysis (LDA) and Principal Component Analysis (PCA) are linear transformation techniques used for dimensionality reduction. PCA can be described as an “unsupervised” algorithm, since it “ignores” class labels and its goal is to find the directions (the so-called principal components) that maximize the variance in a dataset. In contrast to PCA, LDA is “supervised” and computes the directions (“linear discriminants”) that will represent the axes that maximize the separation between multiple classes.
Although it might sound intuitive that LDA is superior to PCA for a multi-class classification task where the class labels are known, this might not always the case. For example, comparisons between classification accuracies for image recognition after using PCA or LDA show that PCA tends to outperform LDA if the number of samples per class is relatively small ([PCA vs. LDA](http://ieeexplore.ieee.org/xpl/articleDetails.jsp?arnumber=908974), A.M. Martinez et al., 2001). In practice, it is also not uncommon to use both LDA and PCA in combination.
Best Practice: PCA for dimensionality reduction can be followed by an LDA. But before we skip to the results of the respective linear transformations, let us quickly recapitulate the purposes of PCA and LDA: PCA finds the axes with maximum variance for the whole data set where LDA tries to find the axes for best class separability. In practice, often a LDA is done followed by a PCA for dimensionality reduction.
Figure.
\*\* To fully understand the details please follow the LDA link to the original and very informative article\*\*
\*\*\* TODO: need some benchmarking for PCA\LDA\LSA\ETC..\*\*
### KDA - KERNEL DISCRIMINANT ANALYSIS
Just as KPCA is the kernel version of PCA, KDA is the kernel version of discriminant analysis. The [pyDML package](https://pydml.readthedocs.io/en/latest/dml.html#dml.kda.KDA) has KDA. This package provides the classic algorithms of supervised distance metric learning, together with some of the newest proposals.
Figure.
### ICA
LDA changes the goal from variance to class separation; ICA changes it from global directions to local, independent ones. While PCA is global, it finds global variables (with images we get eigen faces, good for reconstruction) that maximizes variance in orthogonal directions, and is not influenced by the TRANSPOSE of the data matrix. On the other hand, ICA is local and finds local variables (with images we get eyes ears, mouth, basically edges!, etc). ICA will result differently on TRANSPOSED matrices, unlike PCA, and its also “directional” - consider the “cocktail party” problem. On documents, ICA gives topics. It helps, similarly to PCA, to help us analyze our data.
Sparse [info on ICA with security returns.](https://www.quantopian.com/posts/an-experiment-with-independent-component-analysis)
### LSA
On documents, the linear method most people reach for is LSA, which is SVD applied to text. The same notes are in [LSA (TFIDF + SVD)](/natural-language-processing-nlp/topics-modeling.md#lsa-tfidf--svd).
[LSA](http://mccormickml.com/2016/03/25/lsa-for-text-classification-tutorial/) is quite simple, you just use SVD to perform dimensionality reduction on the tf-idf vectors–that’s really all there is to it! That line is from the latent semantic analysis for text classification tutorial with Python example code. And LSA CLUSTERING, the document clustering example, is kept at the end of the page.
Here is a very nice [tutorial about LSA,](https://technowiki.wordpress.com/2011/08/27/latent-semantic-analysis-lsa-tutorial/) with code, explaining what are the three matrices, word clustering, sentence clustering and vector importance. They say that for sentence space we need to remove the first vector as it is correlated with sentence length. The same text classification tutorial also shows how to [interpret LSA vectors](http://mccormickml.com/2016/03/25/lsa-for-text-classification-tutorial/).
PCA vs LSA: ([intuition1](https://stats.stackexchange.com/questions/65699/lsa-vs-pca-document-clustering), [intuition2](https://math.stackexchange.com/questions/3869/what-is-the-intuitive-relationship-between-svd-and-pca)). The first is a document clustering question that notes that PCA applies SVD to the term-covariance matrix while LSA applies it to the term-document matrix; the second asks what the intuitive relationship between SVD and PCA is, since both are eigenvalue methods that reduce a high-dimensional data set while retaining important information. What LSA buys you is reduction of the dimensionality, noise reduction, and incorporating relations between terms into the representation. SVD and PCA and "total least-squares" (and several other names) are the same thing. It computes the orthogonal transform that decorrelates the variables and keeps the ones with the largest variance. There are two numerical approaches: one by SVD of the (centered) data matrix, and one by Eigen decomposition of this matrix "squared" (covariance).
For text, LSA now competes with word embeddings. [LSA vs W2V](https://arxiv.org/pdf/1610.01520.pdf) is the comparative study of LSA vs Word2vec embeddings in small corpora, a case study in a dreams database.
### MANIFOLD
Every method so far is a linear projection, or a kernel trick on one. Manifold methods instead learn a curved high-to-low mapping, which is why they dominate visualization. [The best tutorial that explains manifold (high to low dim projection/mapping/visuzation)](https://jhui.github.io/2017/01/15/Machine-learning-Multi-dimensional-scaling-and-visualization/) is “Machine learning - Visualization, multi-dimensional scaling, Sammon mapping, IsoMap and t-sne”. [Many manifold methods used to visualize high dimensional data. ](http://scikit-learn.org/stable/modules/manifold.html#t-sne)is the scikit-learn manifold learning guide, the one that opens with "Look for the bare necessities" from Old Mother Nature’s recipes. [Comparing manifold methods](http://scikit-learn.org/stable/auto_examples/manifold/plot_compare_methods.html#sphx-glr-auto-examples-manifold-plot-compare-methods-py) is the illustration of dimensionality reduction on the S-curve dataset with various manifold learning methods.
#### Sammons embedding mapping
The first manifold method in that tutorial is Sammon mapping, and [In tensorflow](https://datawarrior.wordpress.com/2017/06/01/sammon-embedding-with-tensorflow/) is the Sammon Embedding with Tensorflow post from Everything about Data Analytics.
#### T-SNE
t-SNE is the manifold method this page spends the most time on, and the reading list carries its own warning about misreading it. The post is the code and in-depth tutorial on TSNE, mapping probabilities to distributions\*\*\*\*\*\*\*\*. A great example of using PCA and then TSNE to see clusters that arent visible with PCA only is kept at the end of the page. [Misreading T-SNE](https://distill.pub/2016/misread-tsne/) is Distill's "How to Use t-SNE Effectively": t-SNE is extremely useful for visualizing high-dimensional data, but its plots can sometimes be mysterious or misleading, so this is a very important read.
In contrary to what it says on sklearn’s website, TSNE is not suited ONLY for visualization, you [can also use it for data reduction](https://lvdmaaten.github.io/tsne/). “t-Distributed Stochastic Neighbor Embedding (t-SNE) is a ([prize-winning](http://blog.kaggle.com/2012/11/02/t-distributed-stochastic-neighbor-embedding-wins-merck-viz-challenge/)) technique for dimensionality reduction that is particularly well suited for the visualization of high-dimensional datasets.”
Comparing PCA and TSNE, then pushing PCA to TSNE and seeing what happens (as recommended in SKLEARN), used to be linked here and is kept at the end of the page. A TSNE + AUTOENCODER example is the other combination worth trying.
### TSNE
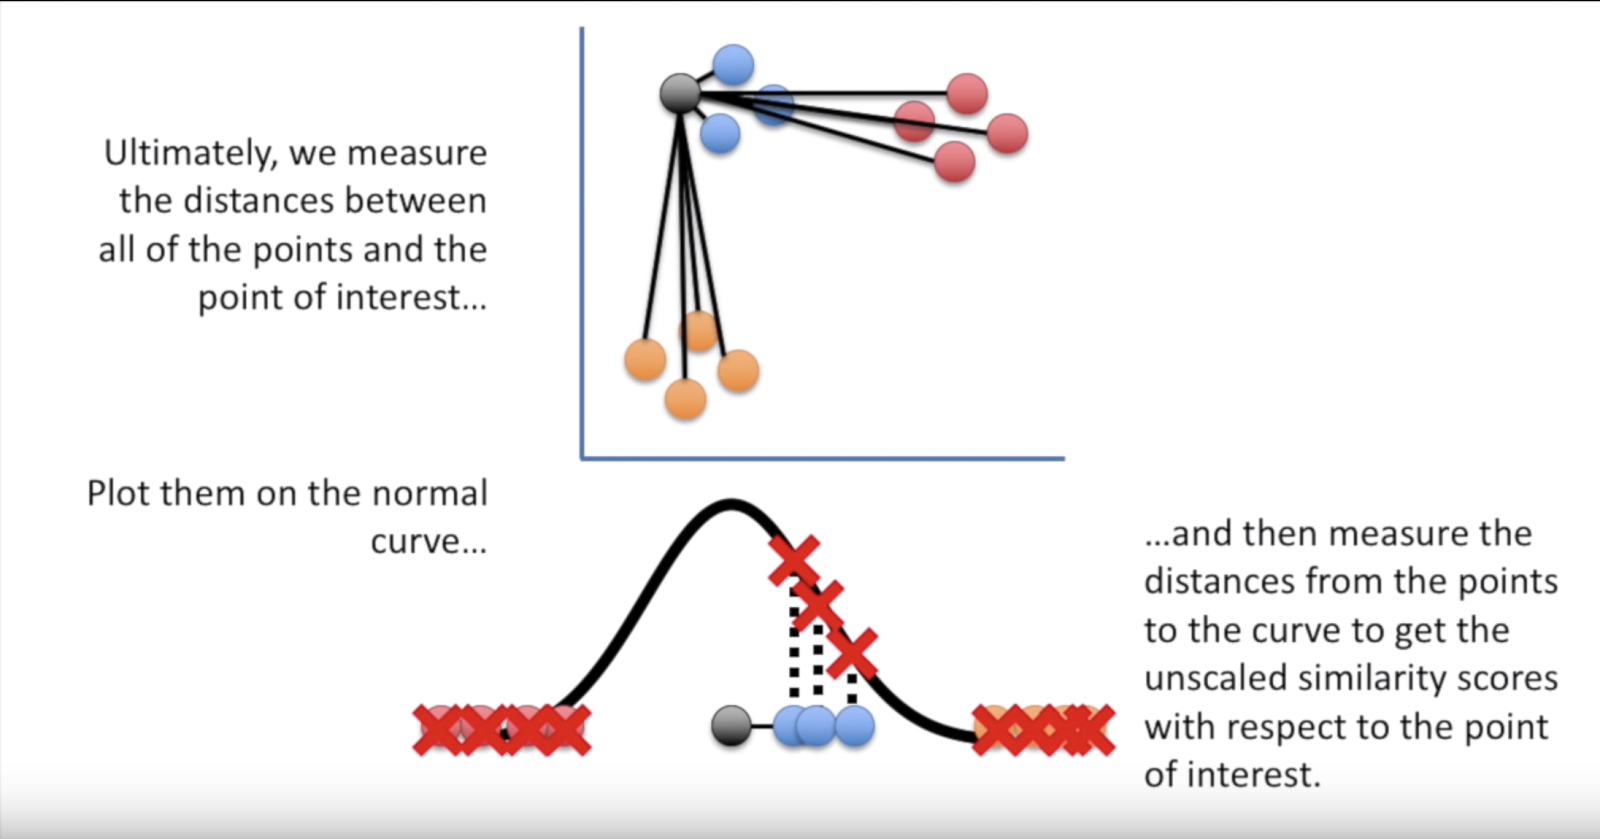
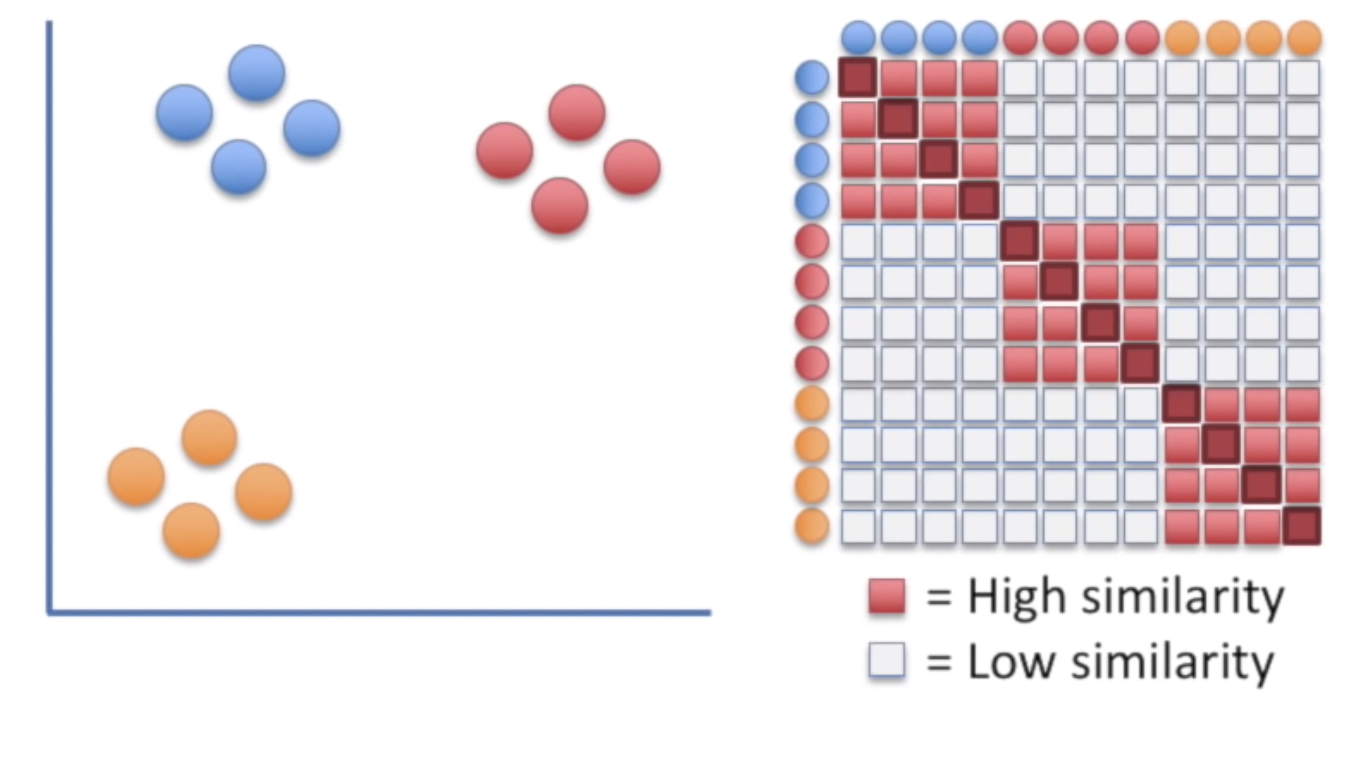
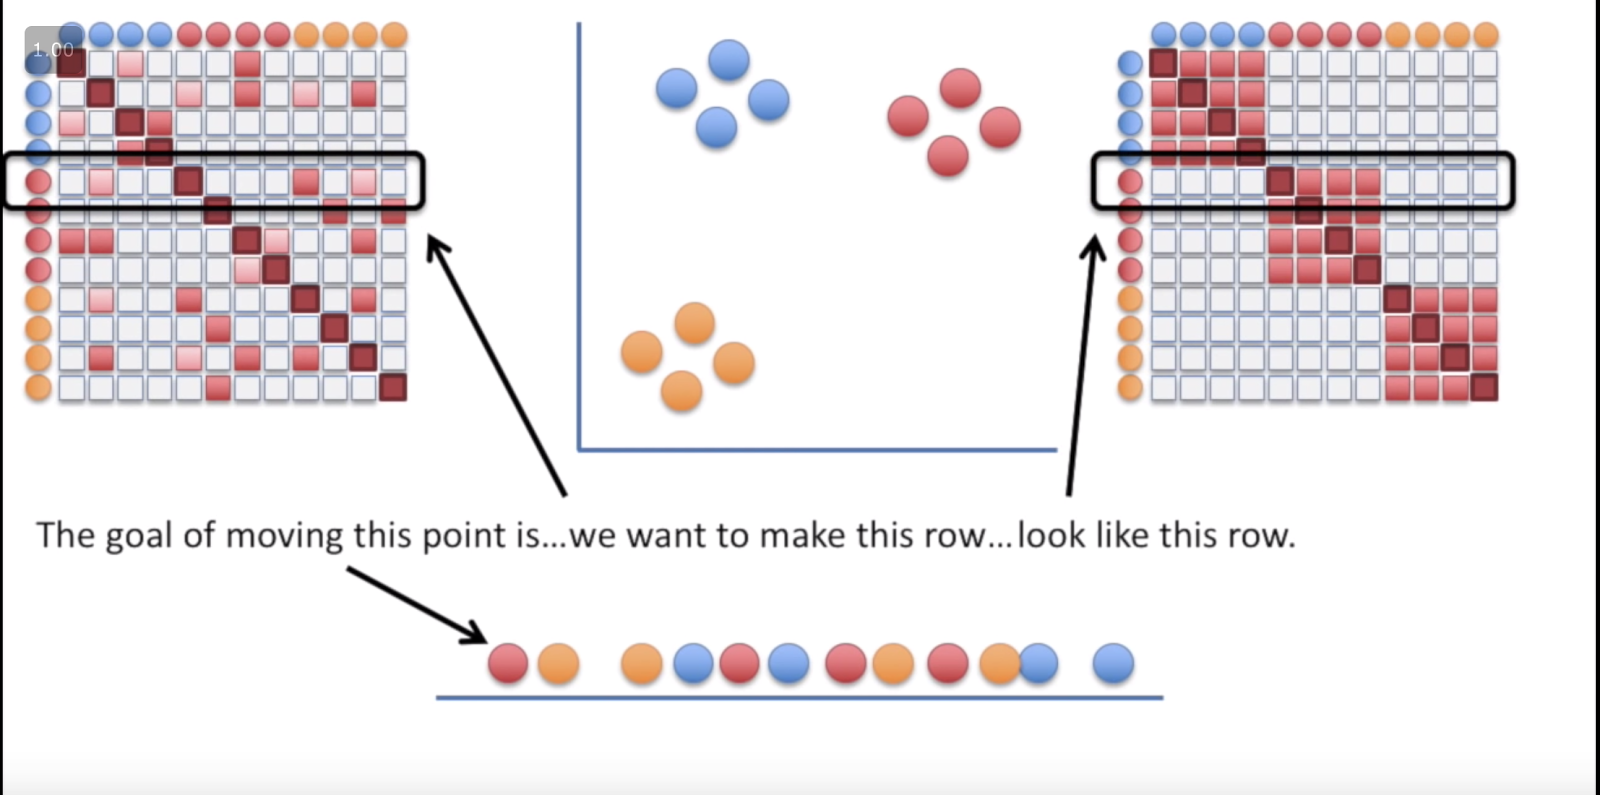
After the reading list, the intuition. [Stat quest](https://www.youtube.com/watch?v=NEaUSP4YerM\&list=PLblh5JKOoLUICTaGLRoHQDuF_7q2GfuJF\&index=30) gives the jist of it: we assume a t- distribution on distances and remove those that are farther, normalized for density. T-dist used so that clusters are not clamped in the middle. The figures below draw that idea.
Figure.
Figure.
Iteratively moving from the left to the right:
Figure.
[TSNE algorithm](https://www.oreilly.com/learning/an-illustrated-introduction-to-the-t-sne-algorithm) is Cyrille Rossant's illustrated introduction to t-distributed stochastic neighbor embedding. The caveats versus PCA come next. [Are there cases where PCA more suitable than TSNE](https://stats.stackexchange.com/questions/238538/are-there-cases-where-pca-is-more-suitable-than-t-sne?rq=1) starts from someone who ran PCA on 7 correlated measures of text correction behaviour and was asked why not t-SNE. [PCA preserving pairwise distances over tSNE?](https://stats.stackexchange.com/questions/176672/what-is-meant-by-pca-preserving-only-large-pairwise-distances) asks what it means that PCA only preserves large pairwise distances, so points far apart in high dimensions also appear far apart in the projection. How why, all here. Another advice about using tsne and the possible misinterpetations is .
#### IVIS
When the dataset is too large for t-SNE, IVIS is a learned alternative. The [Paper: ](https://www.nature.com/articles/s41598-019-45301-0)is "Structure-preserving visualisation of high dimensional single-cell datasets" in Scientific Reports. The [Git](https://github.com/beringresearch/ivis) repository is dimensionality reduction in very large datasets using Siamese Networks, and the [docs](https://bering-ivis.readthedocs.io/en/latest/) are the ivis dimensionality reduction documentation. The companion repositories are [Ivis animate](https://github.com/beringresearch/ivis-animate), beringresearch/ivis-animate, and [Ivis explain](https://github.com/beringresearch/ivis-explain), beringresearch/ivis-explain.
#### DIMENSIONALITY REDUCTION
The page ends where dimensionality reduction meets regression: reducing the features and then fitting a model on them. The same notes are in [PCA](#pca).
PRINCIPAL COMPONENT REGRESSION (PCR) / PARTIAL LEAST SQUARES (PLS)
[Principal component regression (PCR) Partial least squares and (PLS)](https://www.kdnuggets.com/2017/11/10-statistical-techniques-data-scientists-need-master.html/2) - basically PCA and linear regression, however PLS makes use of the response variable in order to identify the new features.
One can describe Principal Components Regression as an approach for deriving a low-dimensional set of features from a large set of variables. The first principal component direction of the data is along which the observations vary the most. In other words, the first PC is a line that fits as close as possible to the data. One can fit p distinct principal components. The second PC is a linear combination of the variables that is uncorrelated with the first PC, and has the largest variance subject to this constraint. The idea is that the principal components capture the most variance in the data using linear combinations of the data in subsequently orthogonal directions. In this way, we can also combine the effects of correlated variables to get more information out of the available data, whereas in regular least squares we would have to discard one of the correlated variables.
The PCR method that we described above involves identifying linear combinations of X that best represent the predictors. These combinations (directions) are identified in an unsupervised way, since the response Y is not used to help determine the principal component directions. That is, the response Y does not supervise the identification of the principal components, thus there is no guarantee that the directions that best explain the predictors also are the best for predicting the response (even though that is often assumed). Partial least squares (PLS) are a supervised alternative to PCR. Like PCR, PLS is a dimension reduction method, which first identifies a new smaller set of features that are linear combinations of the original features, then fits a linear model via least squares to the new M features. Yet, unlike PCR, PLS makes use of the response variable in order to identify the new features.
## Deprecated links
{% hint style="warning" %}
These links and images no longer work. The original wording is kept here. A same-resource copy, when one was checked, is used above.
{% endhint %}
* 1. This address no longer opens:
* 2. This address no longer opens:
* 3. This address no longer opens:
* A small blog post about PCA, AE & TSNE. This address no longer opens:
* Visualizing PCA/TSNE using plots. This address no longer opens:
* An in-depth tutorial on PCA (paper). This address no longer opens:
* An explanation about SVD’s formulas.. This address no longer opens:
* First they say that. This address no longer opens:
* A comprehensive tutorial on LDA - read!. This address no longer opens:
* LSA CLUSTERING. This address no longer opens:
* A great example of using PCA and then TSNE to see clusters that arent visible with PCA only.. This address no longer opens:
* Comparing PCA and TSNE, then pushing PCA to TSNE and seeing what happens (as recommended in SKLEARN. This address no longer opens:
---
# Agent Instructions
This documentation is published with GitBook. GitBook is the documentation platform designed so that both humans and AI agents can read, navigate, and reason over technical content effectively. Learn more at gitbook.com.
## Querying This Documentation
If you need additional information that is not directly available in this page, you can query the documentation by asking a question.
Perform an HTTP GET request on the following URL with the `ask` and `goal` query parameters:
```
GET https://www.mlcompendium.com/predictive-ml/dimensionality-reduction-methods.md?ask=&goal=
```
`ask` is the immediate question: it should be specific, self-contained, and written in natural language.
`goal` is what the user is ultimately trying to achieve, the reason they need the answer. Sharing it helps GitBook give you a better, more relevant answer. A goal is most helpful when it describes the outcome the user wants rather than restating the question. For example, with `ask=how do I create an API token`, a goal like `automate deployments from our CI pipeline` lets GitBook tailor the answer to that use case.
The response will contain a direct answer to the question and relevant excerpts and sources from the documentation.
Use this mechanism when the answer is not explicitly present in the current page, you need clarification or additional context, or you want to retrieve related documentation sections.