> For the complete documentation index, see [llms.txt](https://www.mlcompendium.com/llms.txt). Markdown versions of documentation pages are available by appending `.md` to page URLs; this page is available as [Markdown](https://www.mlcompendium.com/machine-learning/timeseries.md).
# Timeseries
1. [**Random walk**](https://machinelearningmastery.com/gentle-introduction-random-walk-times-series-forecasting-python/) **- what is?**
1. [**Time series decomposition book**](https://otexts.com/fpp2/forecasting-decomposition.html) **- stl x11 seats**
2. [**Mastery on ts decomposition**](https://machinelearningmastery.com/decompose-time-series-data-trend-seasonality/)
### **TOOLS**
1. **SKtime - is a sk-based api,** [**medium**](https://towardsdatascience.com/sktime-a-unified-python-library-for-time-series-machine-learning-3c103c139a55)**, integrates algos from tsfresh and tslearn**
2. **(really good)** [**A LightGBM Autoregressor — Using Sktime**](https://towardsdatascience.com/a-lightgbm-autoregressor-using-sktime-6402726e0e7b)**, explains about the basics in time series prediction, splitting, next step, delayed step, multi step, deseason.**
3. [**SKtime-DL - using keras and DL**](https://github.com/sktime/sktime-dl)
4. [**TSFresh**](http://tsfresh.readthedocs.io) **- extracts 1200 features, filters them using FDR for time series classification etc**
5. [**TSlearn**](http://tslearn.readthedocs.io) **- DTW, shapes, shapelets (keras layer), time series kmeans/clustering/svm/svr/KNN/bary centers/PAA/SAX** 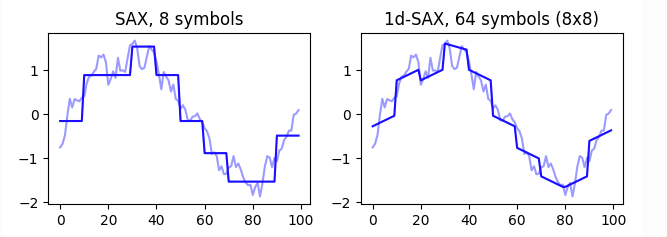
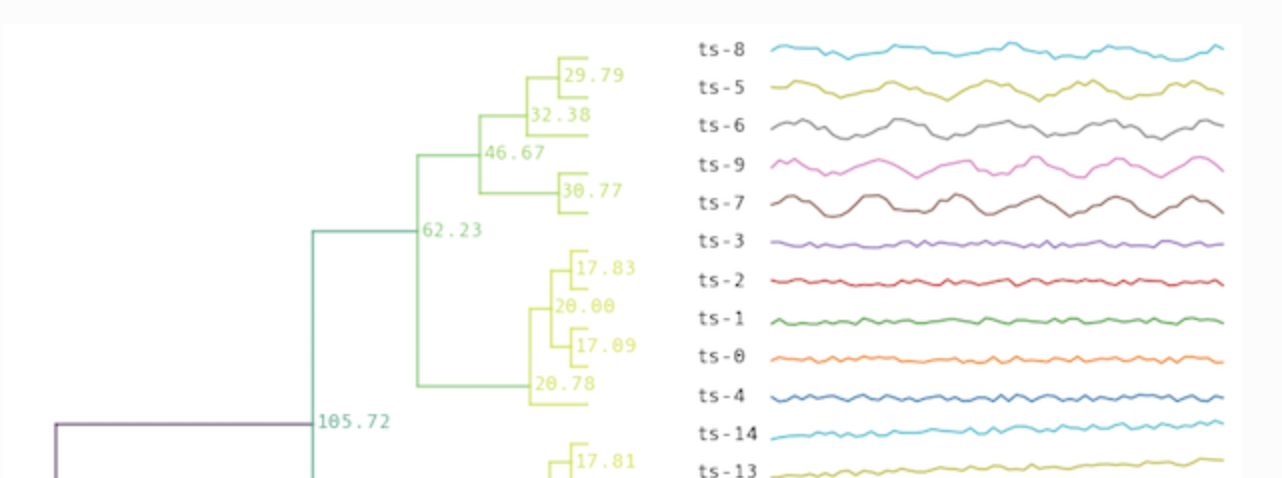
6. [**DTAIDistance**](https://dtaidistance.readthedocs.io/en/latest/index.html) **- Library for time series distances (e.g. Dynamic Time Warping) used in the** [**DTAI Research Group**](https://dtai.cs.kuleuven.be/)**. The library offers a pure Python implementation and a faster implementation in C. The C implementation has only Cython as a dependency. It is compatible with Numpy and Pandas and implemented to avoid unnecessary data copy operations**\
[**dtaidistance.clustering.hierarchical**](https://dtaidistance.readthedocs.io/en/latest/modules/clustering/hierarchical.html)
7. [**Darts**](https://unit8co.github.io/darts/) is a Python library for user-friendly forecasting and anomaly detection on time series. [Forecasting models](https://unit8co.github.io/darts/#forecasting-models) & [Examples](https://unit8co.github.io/darts/#example-usage)
[**Ddtaidistance.clustering.kmeans**](https://dtaidistance.readthedocs.io/en/latest/modules/clustering/kmeans.html)
[**Dtaidistance.clustering.medoids**](https://dtaidistance.readthedocs.io/en/latest/modules/clustering/medoids.html)
**\* Identify anomalies, outliers or abnormal behaviour (see for example the** [**anomatools package**](https://github.com/Vincent-Vercruyssen/anomatools)**).**
1. **Semi supervised with DTAIDistance - Active semi-supervised clustering**
**The recommended method for perform active semi-supervised clustering using DTAIDistance is to use the COBRAS for time series clustering:** [**https://github.com/ML-KULeuven/cobras**](https://github.com/ML-KULeuven/cobras)**. COBRAS is a library for semi-supervised time series clustering using pairwise constraints, which natively supports both dtaidistance.dtw and kshape.**
1. [**Affine warp**](https://github.com/ahwillia/affinewarp)**, a neural net with time warping - as part of the following manuscript, which focuses on analysis of large-scale neural recordings (though this code can be also be applied to many other data types)**
2. [**Neural warp**](https://github.com/josifgrabocka/neuralwarp) **-** [**NeuralWarp**](https://arxiv.org/pdf/1812.08306.pdf)**: Time-Series Similarity with Warping Networks**
3.
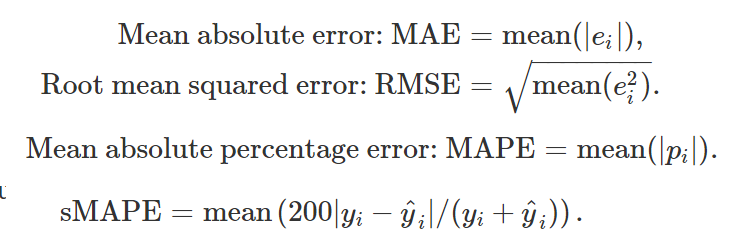
[**A great introduction into time series**](https://medium.com/making-sense-of-data/time-series-next-value-prediction-using-regression-over-a-rolling-window-228f0acae363) **- “The approach is to come up with a list of features that captures the temporal aspects so that the auto correlation information is not lost.” basically tells us to take sequence features and create (auto)-correlated new variables using a time window, i.e., “Time series forecasts as regression that factor in autocorrelation as well.”. we can transform raw features into other type of features that explain the relationship in time between features. we measure success using loss functions, MAE RMSE MAPE RMSEP AC-ERROR-RATE**
[**Interesting idea**](http://blog.kaggle.com/2016/02/03/rossmann-store-sales-winners-interview-2nd-place-nima-shahbazi/) **on how to define ‘time series’ dummy variables that utilize beginning\end of certain holiday events, including important information on what NOT to filter even if it seems insignificant, such as zero sales that may indicate some relationship to many sales the following day.**
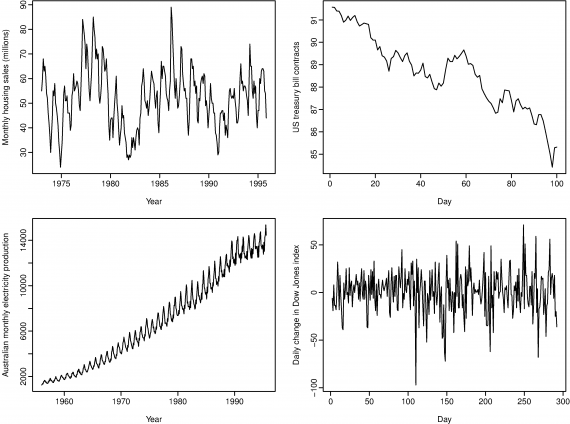
[**Time series patterns:** ](https://www.otexts.org/fpp/2/1)
* **A trend (a,b,c) exists when there is a long-term increase or decrease in the data.**
* **A seasonal (a - big waves) pattern occurs when a time series is affected by seasonal factors such as the time of the year or the day of the week. The monthly sales induced by the change in cost at the end of the calendar year.**
* **A cycle (a) occurs when the data exhibit rises and falls that are not of a fixed period - sometimes years.**
[**Some statistical measures**](https://www.otexts.org/fpp/2/2) **(mean, median, percentiles, iqr, std dev, bivariate statistics - correlation between variables)**
**Bivariate Formula: this correlation measures the extent of a linear relationship between two variables. high number = high correlation between two variable. The value of r always lies between -1 and 1 with negative values indicating a negative relationship and positive values indicating a positive relationship. Negative = decreasing, positive = increasing.**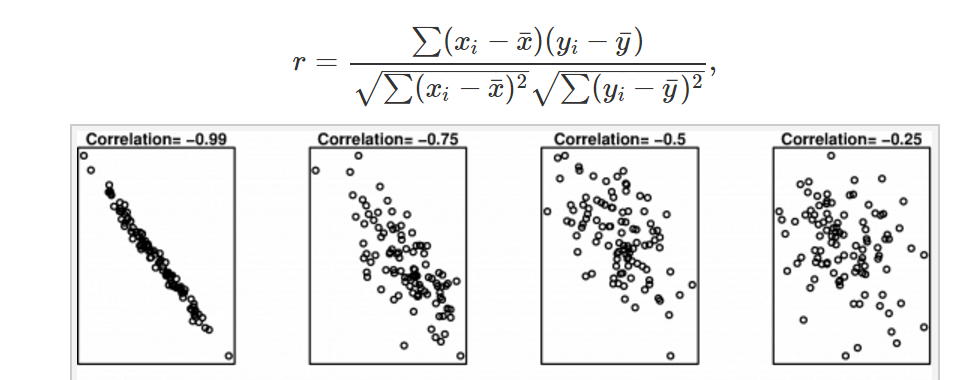
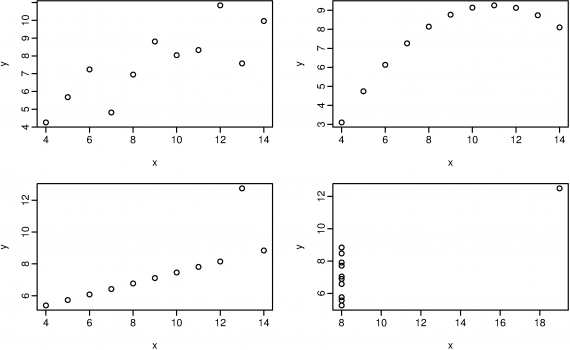
**But correlation can LIE, the following has 0.8 correlation for all of the graphs:**
**Autocorrelation measures the linear relationship between lagged values of a time series.**
**L8 is correlated, and has a high measure of 0.83**
* **White-noise has autocorrelation of 0.**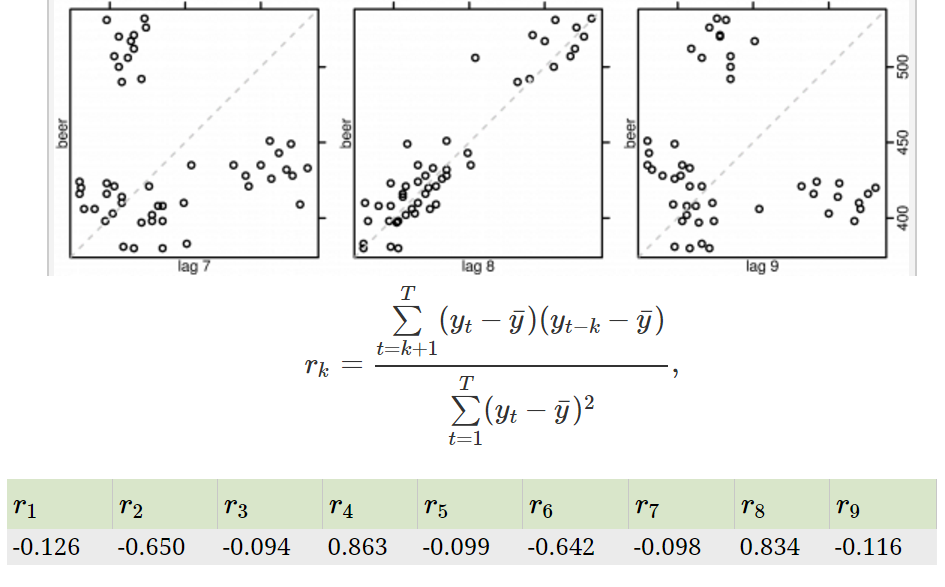
### [**Forecasting methods**](https://www.otexts.org/fpp/2/3)
* **Average: Forecasts of all future values are equal to the mean of the historical data.**
* **Naive: Forecasts are simply set to be the value of the last observation.**
* **Seasonal Naive: forecast to be equal to the last observed value from the same season of the year**
* **Drift: A variation on the naïve method is to allow the forecasts to increase or decrease over time, the drift is set to be the average change seen in the historical data.**
### [**Data Transformations**](https://www.otexts.org/fpp/2/4)
* **Log**
* **Box cox**
* **Back transform**
* **Calendrical adjustments**
* **Inflation adjustment**
[**Transforming time series data to tabular (in order to use tabular based approach)**](https://towardsdatascience.com/approaching-time-series-with-a-tree-based-model-87c6d1fb6603)
### **SPLITTING TIME SERIES DATA**
1. **SK-lego** [**With a gap**](https://scikit-lego.readthedocs.io/en/latest/timegapsplit.html) **-** [**now with even timeseries split by group**](https://towardsdatascience.com/a-highly-anticipated-time-series-cross-validator-is-finally-here-7dc99f672736)
### [**Evaluate forecast accuracy**](https://www.otexts.org/fpp/2/5)
* **Dummy variables: sunday, monday, tues,wed,thurs, friday. NO SATURDAY!**
* **notice that only six dummy variables are needed to code seven categories. That is because the seventh category (in this case Sunday) is specified when the dummy variables are all set to zero. Many beginners will try to add a seventh dummy variable for the seventh category. This is known as the "dummy variable trap" because it will cause the regression to fail.**
* **Outliers: If there is an outlier in the data, rather than omit it, you can use a dummy variable to remove its effect. In this case, the dummy variable takes value one for that observation and zero everywhere else.**
* **Public holidays: For daily data, the effect of public holidays can be accounted for by including a dummy variable predictor taking value one on public holidays and zero elsewhere.**
* **Easter: is different from most holidays because it is not held on the same date each year and the effect can last for several days. In this case, a dummy variable can be used with value one where any part of the holiday falls in the particular time period and zero otherwise.**
* **Trading days: The number of trading days in a month can vary considerably and can have a substantial effect on sales data. To allow for this, the number of trading days in each month can be included as a predictor. An alternative that allows for the effects of different days of the week has the following predictors. # Mondays in month;# Tuesdays in month;# Sundays in month.**
* **Advertising: $advertising for previous month;$advertising for two months previously**
### [**Rolling window analysis**](https://link.springer.com/chapter/10.1007%2F978-0-387-32348-0_9)
**“compute parameter estimates over a rolling window of a fixed size through the sample. If the parameters are truly constant over the entire sample, then the estimates over the rolling windows should not be too different. If the parameters change at some point during the sample, then the rolling estimates should capture this instability”**
### [**Moving average window**](https://www.otexts.org/fpp/6/2)
**estimate the trend cycle**
* **3-5-7-9? If its too large its going to flatten the curve, too low its going to be similar to the actual curve.**
* **two tier moving average, first 4 then 2 on the resulted moving average.**
[**Visual example**](https://www.youtube.com/watch?v=_YXoRTQQI3U) **of ARIMA algorithm - captures the time series trend or forecast.**
### **Decomposition**
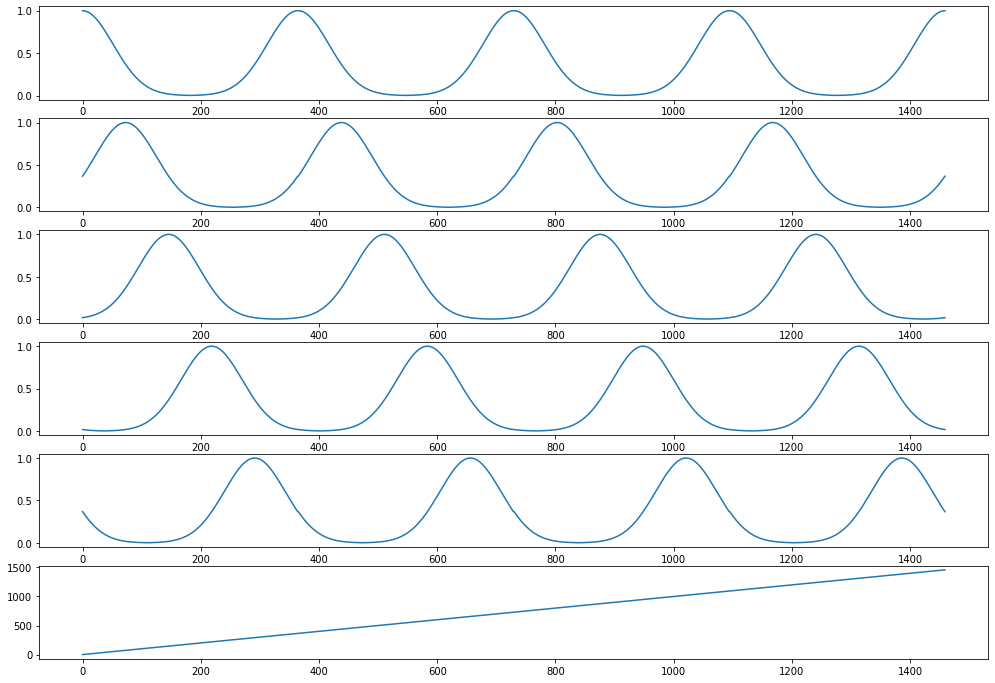
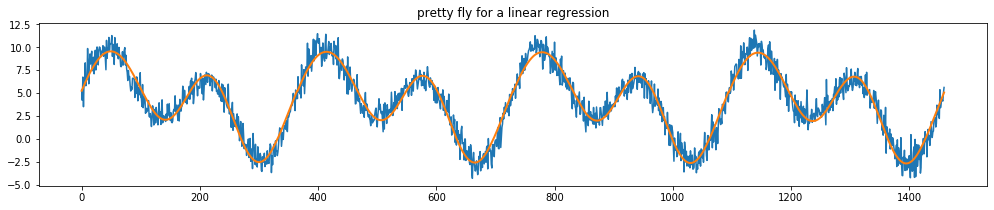
1. [**Creating**](https://scikit-lego.readthedocs.io/en/latest/preprocessing.html#Repeating-Basis-Function-Transformer) **curves to explain a complex seasonal fit.**
2. 
3. 
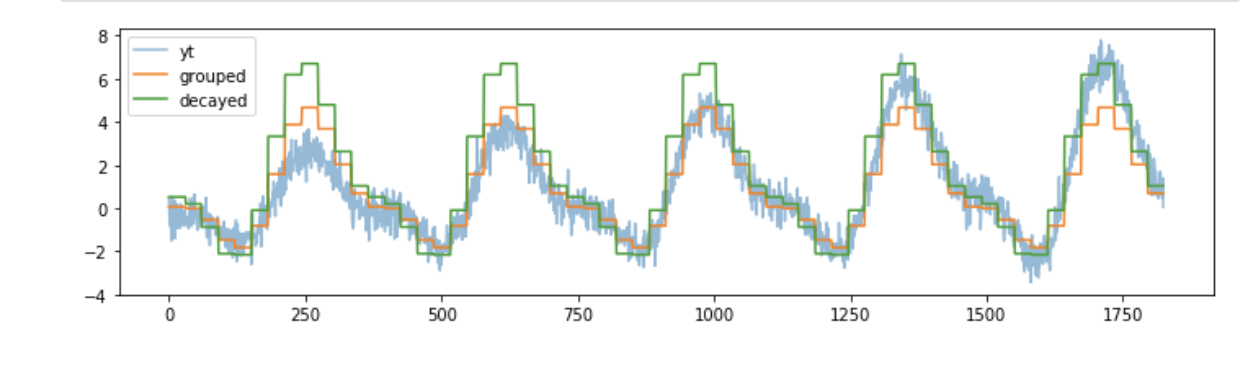
### **Weighted “window”**
[**1, scikit-lego with a decay estimator**](https://scikit-lego.readthedocs.io/en/latest/meta.html#Decayed-Estimation)
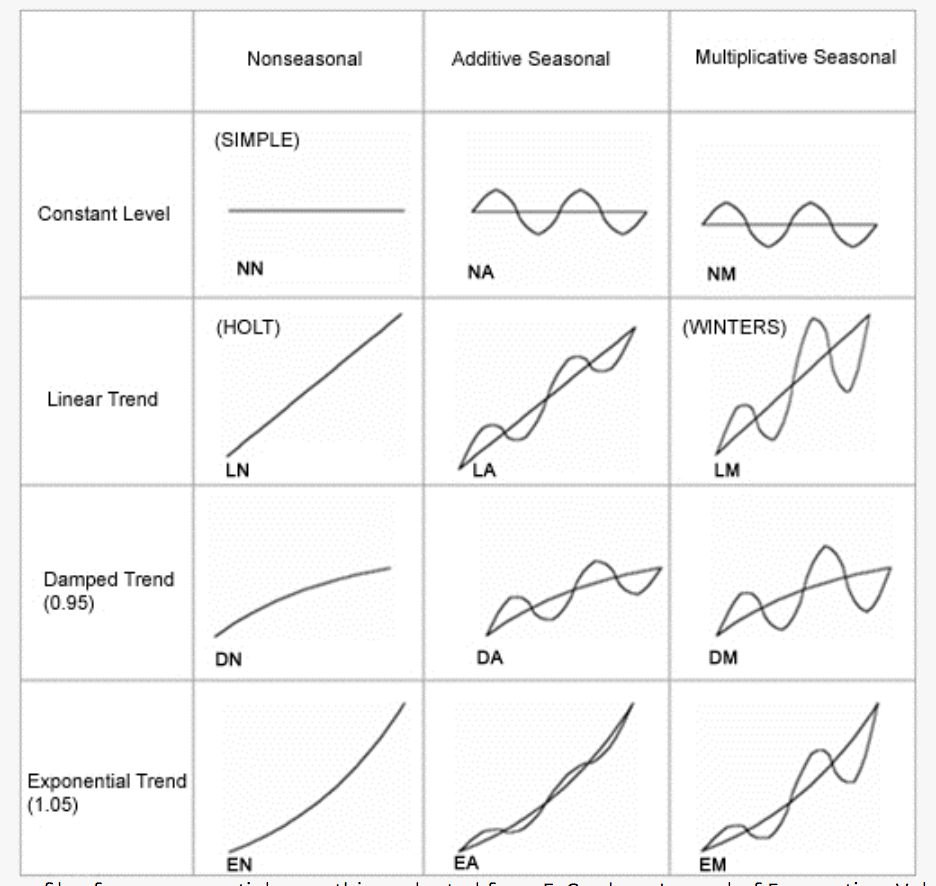
### [**Time Series Components**](http://machinelearningmastery.com/time-series-forecasting/)
1. **Level. The baseline value for the series if it were a straight line.**
2. **Trend. The optional and often linear increasing or decreasing behavior of the series over time.**
3. **Seasonality. The optional repeating patterns or cycles of behavior over time.**
4. **Noise. The optional variability in the observations that cannot be explained by the model.**
**All time series have a level, most have noise, and the trend and seasonality are optional.**
**One step forecast using a window of “1” and a typical sample “time, measure1, measure2”:**
* **linear/nonlinear classifiers: predict a single output value - using the t-1 previous line, i.e., “measure1 t, measure 2 t, measure 1 t+1, measure 2 t+1 (as the class)”**
* **Neural networks: predict multiple output values, i.e., “measure1 t, measure 2 t, measure 1 t+1(class1), measure 2 t+1(class2)”**
**One-Step Forecast: This is where the next time step (t+1) is predicted.**
**Multi-Step Forecast: This is where two or more future time steps are to be predicted.**
**Multi-step forecast using a window of “1” and a typical sample “time, measure1”, i.e., using the current value input we label it as the two future input labels:**
* **“measure1 t, measure1 t+1(class) , measure1 t+2(class1)”**
[**This article explains**](http://web.engr.oregonstate.edu/~tgd/publications/mlsd-ssspr.pdf) **about ML Methods for Sequential Supervised Learning - Six methods that have been applied to solve sequential supervised learning problems:**
1. **sliding-window methods - converts a sequential supervised problem into a classical supervised problem**
2. **recurrent sliding windows**
3. **hidden Markov models**
4. **maximum entropy Markov models**
5. **input-output Markov models**
6. **conditional random fields**
7. **graph transformer networks**
##
### **STATIONARY TIME SERIES**
[**What is?**](https://machinelearningmastery.com/time-series-data-stationary-python/) **A time series without a trend or seasonality, in other words non-stationary has a trend or seasonality**
**There are ways to** [**remove the trend and seasonality**](https://machinelearningmastery.com/difference-time-series-dataset-python/)**, i.e., take the difference between time points.**
1. **T+1 - T**
2. **Bigger lag to support seasonal changes**
3. **pandas.diff()**
4. **Plot a histogram, plot a log(X) as well.**
5. **Test for the unit root null hypothesis - i.e., use the Augmented dickey fuller test to determine if two samples originate in a stationary or a non-stationary (seasonal/trend) time series**
[**Shay on stationary time series, AR, ARMA**](https://towardsdatascience.com/stationarity-in-time-series-analysis-90c94f27322)
**(amazing)** [**STL**](https://otexts.com/fpp2/stl.html) **and more.**
### **SHORT TIME SERIES**
1. [**Short time series**](https://robjhyndman.com/hyndsight/short-time-series/)
2. [**PDarima -**](https://towardsdatascience.com/efficient-time-series-using-pythons-pmdarima-library-f6825407b7f0) **Pmdarima‘s auto\_arima function is extremely useful when building an ARIMA model as it helps us identify the most optimal p,d,q parameters and return a fitted ARIMA model.**
3. [**Min sample size for short seasonal time series**](https://robjhyndman.com/papers/shortseasonal.pdf)
4. [**More mastery on short time series.**](https://machinelearningmastery.com/time-series-forecasting-methods-in-python-cheat-sheet/?fbclid=IwAR0iU9B-wsRaOPOY13F4xesGWUMevRBuPck5I9jTNlV5zmPFCX1NoG05_jI)
1. **Autoregression (AR)**
2. **Moving Average (MA)**
3. **Autoregressive Moving Average (ARMA)**
4. **Autoregressive Integrated Moving Average (ARIMA)**
5. **Seasonal Autoregressive Integrated Moving-Average (SARIMA)**
6. **Seasonal Autoregressive Integrated Moving-Average with Exogenous Regressors (SARIMAX)**
7. **Vector Autoregression (VAR)**
8. **Vector Autoregression Moving-Average (VARMA)**
9. **Vector Autoregression Moving-Average with Exogenous Regressors (VARMAX)**
10. **Simple Exponential Smoothing (SES)**
11. **Holt Winter’s Exponential Smoothing (HWES)**
**Predicting actual Values of time series using observations**
1. [**Using kalman filters**](https://www.youtube.com/watch?v=CaCcOwJPytQ) **- explains the concept etc, 1 out of 55 videos.**
### [**Kalman filters in matlab**](https://www.youtube.com/watch?v=4OerJmPpkRg)
### [**LTSM for time series**](http://machinelearningmastery.com/time-series-prediction-lstm-recurrent-neural-networks-python-keras/)
**There are three types of gates within a unit:**
* **Forget Gate: conditionally decides what information to throw away from the block.**
* **Input Gate: conditionally decides which values from the input to update the memory state.**
* **Output Gate: conditionally decides what to output based on input and the memory of the block.**
**Using lstm to predict sun spots, has some autocorrelation usage**
* [**Part 1**](https://www.business-science.io/timeseries-analysis/2018/04/18/keras-lstm-sunspots-time-series-prediction.html)
* [**Part 2**](https://www.business-science.io/timeseries-analysis/2018/07/01/keras-lstm-sunspots-part2.html)
### **CLASSIFICATION**
1. [**Stackexchange**](https://stats.stackexchange.com/questions/131281/dynamic-time-warping-clustering/131284) **- Yes, you can use DTW approach for classification and clustering of time series. I've compiled the following resources, which are focused on this very topic (I've recently answered a similar question, but not on this site, so I'm copying the contents here for everybody's convenience):**
* **UCR Time Series Classification/Clustering:** [**main page**](http://www.cs.ucr.edu/~eamonn/time_series_data)**,** [**software page**](http://www.cs.ucr.edu/~eamonn/UCRsuite.html) **and** [**corresponding paper**](http://www.cs.ucr.edu/~eamonn/SIGKDD_trillion.pdf)
* **Time Series Classification and Clustering with Python:** [**a blog post**](http://alexminnaar.com/2014/04/16/Time-Series-Classification-and-Clustering-with-Python.html)
* **Capital Bikeshare: Time Series Clustering:** [**another blog post**](http://ofdataandscience.blogspot.com/2013/03/capital-bikeshare-time-series-clustering.html)
* **Time Series Classification and Clustering:** [**ipython notebook**](http://nbviewer.ipython.org/github/alexminnaar/time-series-classification-and-clustering/blob/master/Time%20Series%20Classification%20and%20Clustering.ipynb)
* **Dynamic Time Warping using rpy and Python:** [**another blog post**](https://nipunbatra.wordpress.com/2013/06/09/dynamic-time-warping-using-rpy-and-python)
* **Mining Time-series with Trillions of Points: Dynamic Time Warping at Scale:** [**another blog post**](http://practicalquant.blogspot.com/2012/10/mining-time-series-with-trillions-of.html)
* **Time Series Analysis and Mining in R (to add R to the mix):** [**yet another blog post**](http://rdatamining.wordpress.com/2011/08/23/time-series-analysis-and-mining-with-r)
* **And, finally, two tools implementing/supporting DTW, to top it off:** [**R package**](http://rdatamining.wordpress.com/2011/08/23/time-series-analysis-and-mining-with-r) **and** [**Python module**](http://mlpy.sourceforge.net/)
### **CLUSTERING TS**
1. [**Clustering time series, subsequences with a rolling window, the pitfall.**](https://towardsdatascience.com/dont-make-this-mistake-when-clustering-time-series-data-d9403f39bbb2)
2. [**Clustering using tslearn**](https://tslearn.readthedocs.io/en/stable/user_guide/clustering.html)
3. [**Kmeans for variable length**](https://medium.com/@iliazaitsev/how-to-classify-a-dataset-with-observations-of-various-length-96fab8e95baf) **,** [**notebook**](https://github.com/devforfu/Blog/blob/master/trees/scikit_learn.py)
### **ANOMALY DETECTION TS**
1. [**What is stationary (process**](https://en.wikipedia.org/wiki/Stationary_process)**),** [**stationary time series analysis**](https://towardsdatascience.com/stationarity-in-time-series-analysis-90c94f27322) **(shay palachi),**
2. [**mastery on arimas**](https://machinelearningmastery.com/time-series-forecasting-methods-in-python-cheat-sheet/?fbclid=IwAR0iU9B-wsRaOPOY13F4xesGWUMevRBuPck5I9jTNlV5zmPFCX1NoG05_jI)
3. [**TS anomaly algos (stl, trees, arima)**](https://blog.statsbot.co/time-series-anomaly-detection-algorithms-1cef5519aef2)
4. [**AD techniques**](https://medium.com/dp6-us-blog/anomaly-detection-techniques-c3817e8e7b2f)**, part** [**2**](https://medium.com/dp6-us-blog/anomaly-detection-techniques-part-ii-9a08b6562619)**, part** [**3**](https://medium.com/dp6-us-blog/anomaly-detection-techniques-part-iii-d27e7b0d6c8a)
5. [**Z-score, modified z-score and iqr an intro why z-score is not robust**](http://colingorrie.github.io/outlier-detection.html)
6. [**Adtk**](https://adtk.readthedocs.io/en/stable/userguide.html) **a sklearn-like toolkit with an amazing intro, various algorithms for non seasonal and seasonal, transformers, ensembles.**
7. [**Awesome TS anomaly detection**](https://github.com/rob-med/awesome-TS-anomaly-detection) **on github**
8. [**Transfer learning toolkit**](https://github.com/FuzhenZhuang/Transfer-Learning-Toolkit)**,** [**paper and benchmarks**](https://arxiv.org/pdf/1911.08967.pdf)
9. [**Ransac is a good baseline**](https://medium.com/@iamhatesz/random-sample-consensus-bd2bb7b1be75) **- random sample consensus for outlier detection**
1. [**Ransac**](https://medium.com/@angel.manzur/got-outliers-ransac-them-f12b6b5f606e)**,** [**2**](https://medium.com/@saurabh.dasgupta1/outlier-detection-using-the-ransac-algorithm-de52670adb4a)**,** [**3**](https://towardsdatascience.com/detecting-the-fault-line-using-k-mean-clustering-and-ransac-9a74cb61bb96)**,** [**4**](http://www.cs.tau.ac.il/~turkel/imagepapers/RANSAC4Dummies.pdf)**, 5, 6**
2. **You can feed ransac with tsfresh/tslearn features.**
10. [**Anomaly detection for time series**](https://medium.com/@jetnew/anomaly-detection-of-time-series-data-e0cb6b382e33)**,**
11. **AD for TS, recommended by DTAIDistance,** [**anomatools**](https://github.com/Vincent-Vercruyssen/anomatools)
12. **STL:**
1. [**AD where anomalies coincide with seasonal peaks!!**](https://medium.com/@richa.mishr01/anomaly-detection-in-seasonal-time-series-where-anomalies-coincide-with-seasonal-peaks-9859a6a6b8ba)
2. [**AD challenges, stationary, seasonality, trend**](https://cloudfabrix.com/blog/aiops/anomaly-detection-time-series-data/)
3. [**Rt anomaly detection for time series pinterest**](https://medium.com/pinterest-engineering/building-a-real-time-anomaly-detection-system-for-time-series-at-pinterest-a833e6856ddd) **using stl decomposition**
4. [**AD**](https://medium.com/wwblog/anomaly-detection-using-stl-76099c9fd5a7)
13. **Sliding windows**
1. [**Solving sliding window problems**](https://medium.com/outco/how-to-solve-sliding-window-problems-28d67601a66)
2. [**Rolling window regression**](https://medium.com/making-sense-of-data/time-series-next-value-prediction-using-regression-over-a-rolling-window-228f0acae363)
14. **Forecasting using Arima** [**1**](https://towardsdatascience.com/time-series-forecasting-using-auto-arima-in-python-bb83e49210cd)**,** [**2**](http://alkaline-ml.com/pmdarima/)
15. **Auto arima** [**1**](https://towardsdatascience.com/time-series-forecasting-using-auto-arima-in-python-bb83e49210cd)**,** [**2**](https://stackoverflow.com/questions/22770352/auto-arima-equivalent-for-python)**,** [**3**](https://www.analyticsvidhya.com/blog/2018/08/auto-arima-time-series-modeling-python-r/)
16. [**Twitters ESD test**](https://medium.com/@elisha_12808/time-series-anomaly-detection-with-twitters-esd-test-50cce409ced1) **for outliers, using z-score and t test**
1. **Another esd test inside** [**here**](https://towardsdatascience.com/anomaly-detection-def662294a4e)
17. [**Minimal sample size for seasonal forecasting**](https://robjhyndman.com/papers/shortseasonal.pdf)
18. [**Golden signals**](https://www.usenix.org/conference/srecon19asia/presentation/chen-yu)**,** [**youtube**](https://www.youtube.com/watch?v=3T9ZzQQiPSo)
19. [**Graph-based Anomaly Detection and Description: A Survey**](https://arxiv.org/pdf/1404.4679.pdf)
20. [**Time2vec**](https://towardsdatascience.com/time2vec-for-time-series-features-encoding-a03a4f3f937e)**,** [**paper**](https://arxiv.org/pdf/1907.05321.pdf) **(for deep learning, as a layer)**
###
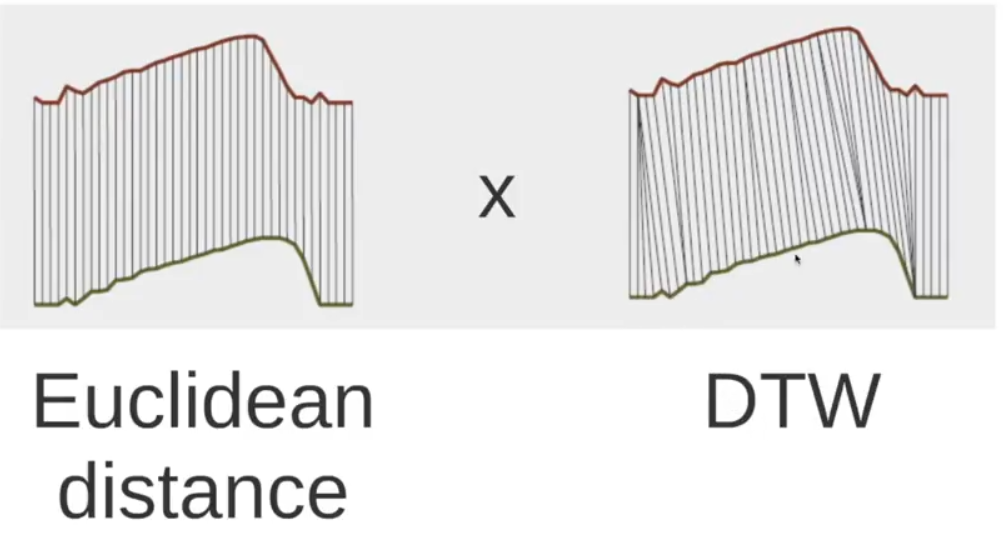
### **Dynamic Time Warping (DTW)**
**DTW, ie., how to compute a better distance for two time series.**
1. [**The three myths of using DTW**](http://alumni.cs.ucr.edu/~ratana/RatanamC.pdf)
**Myth 1: The ability of DTW to handle sequences of different lengths is a great advantage, and therefore the simple lower bound that requires different-length sequences to be reinterpolated to equal length is of limited utility \[10]\[19]\[21]. In fact, as we will show, there is no evidence in the literature to suggest this, and extensive empirical evidence presented here suggests that comparing sequences of different lengths and reinterpolating them to equal length produce no statistically significant difference in accuracy or precision/recall.**\
**Myth 2: Constraining the warping paths is a necessary evil that we inherited from the speech processing community to make DTW tractable, and that we should find ways to speed up DTW with no (or larger) constraints\[19]. In fact, the opposite is true. As we will show, the 10% constraint on warping inherited blindly from the speech processing community is actually too large for real world data mining.**\
**Myth 3: There is a need (and room) for improvements in the speed of DTW for data mining applications. In fact, as we will show here, if we use a simple lower bounding technique, DTW is essentially O(n) for data mining applications. At least for CPU time, we are almost certainly at the asymptotic limit for speeding up DTW.**
1. [**Youtube - explains everything**](https://www.youtube.com/watch?v=_K1OsqCicBY)
2. [**Python code**](https://github.com/alexminnaar/time-series-classification-and-clustering) **with a** [**good tutorial.**](http://nbviewer.ipython.org/github/alexminnaar/time-series-classification-and-clustering/blob/master/Time%20Series%20Classification%20and%20Clustering.ipynb)
3. **Another function for dtw distance in python**
4. [**Medium**](https://medium.com/datadriveninvestor/dynamic-time-warping-dtw-d51d1a1e4afc)**, mentions prunedDTW, sparseDTW and fastDTW**
5. [**DTW in TSLEARN**](https://tslearn.readthedocs.io/en/latest/user_guide/dtw.html#soft-dtw)
6. [**DynamicTimeWarping**](https://dynamictimewarping.github.io/py-api/html/api/dtw.dtw.html#dtw.dtw) **git**
1. **(duplicate above in classification)** [**Stackexchange**](https://stats.stackexchange.com/questions/131281/dynamic-time-warping-clustering/131284) **- Yes, you can use DTW approach for classification and clustering of time series. I've compiled the following resources, which are focused on this very topic (I've recently answered a similar question, but not on this site, so I'm copying the contents here for everybody's convenience):**
* **UCR Time Series Classification/Clustering:** [**main page**](http://www.cs.ucr.edu/~eamonn/time_series_data)**,** [**software page**](http://www.cs.ucr.edu/~eamonn/UCRsuite.html) **and** [**corresponding paper**](http://www.cs.ucr.edu/~eamonn/SIGKDD_trillion.pdf)
* **Time Series Classification and Clustering with Python:** [**a blog post**](http://alexminnaar.com/2014/04/16/Time-Series-Classification-and-Clustering-with-Python.html)
* **Capital Bikeshare: Time Series Clustering:** [**another blog post**](http://ofdataandscience.blogspot.com/2013/03/capital-bikeshare-time-series-clustering.html)
* **Time Series Classification and Clustering:** [**ipython notebook**](http://nbviewer.ipython.org/github/alexminnaar/time-series-classification-and-clustering/blob/master/Time%20Series%20Classification%20and%20Clustering.ipynb)
* **Dynamic Time Warping using rpy and Python:** [**another blog post**](https://nipunbatra.wordpress.com/2013/06/09/dynamic-time-warping-using-rpy-and-python)
* **Mining Time-series with Trillions of Points: Dynamic Time Warping at Scale:** [**another blog post**](http://practicalquant.blogspot.com/2012/10/mining-time-series-with-trillions-of.html)
* **Time Series Analysis and Mining in R (to add R to the mix):** [**yet another blog post**](http://rdatamining.wordpress.com/2011/08/23/time-series-analysis-and-mining-with-r)
* **And, finally, two tools implementing/supporting DTW, to top it off:** [**R package**](http://rdatamining.wordpress.com/2011/08/23/time-series-analysis-and-mining-with-r) **and** [**Python module**](http://mlpy.sourceforge.net/)
1. [**Time Series Hierarchical Clustering using Dynamic Time Warping in Python**](https://towardsdatascience.com/time-series-hierarchical-clustering-using-dynamic-time-warping-in-python-c8c9edf2fda5) **-** [**notebook**](https://github.com/avchauzov/_articles/blob/master/1.1.trajectoriesClustering.ipynb)
2. [**K-Means with DTW, probably fixed length vectors, using tslearn**](https://towardsdatascience.com/how-to-apply-k-means-clustering-to-time-series-data-28d04a8f7da3)
3. **(nice)** [**With time series**](https://medium.com/@shachiakyaagba_41915/dynamic-time-warping-with-time-series-1f5c05fb8950)
---
# Agent Instructions
This documentation is published with GitBook. GitBook is the documentation platform designed so that both humans and AI agents can read, navigate, and reason over technical content effectively. Learn more at gitbook.com.
## Querying This Documentation
If you need additional information that is not directly available in this page, you can query the documentation dynamically by asking a question.
Perform an HTTP GET request on the current page URL with the `ask` query parameter, and the optional `goal` query parameter:
```
GET https://www.mlcompendium.com/machine-learning/timeseries.md?ask=&goal=
```
`ask` is the immediate question: it should be specific, self-contained, and written in natural language.
`goal` is optional and describes the broader end goal you are ultimately trying to accomplish on behalf of the user. GitBook uses it to tailor the answer towards what is most useful for that goal.
The response will contain a direct answer to the question and relevant excerpts and sources from the documentation.
Use this mechanism when the answer is not explicitly present in the current page, you need clarification or additional context, or you want to retrieve related documentation sections.