> For the complete documentation index, see [llms.txt](https://www.mlcompendium.com/llms.txt). Markdown versions of documentation pages are available by appending `.md` to page URLs; this page is available as [Markdown](https://www.mlcompendium.com/validation-and-evaluation/evaluation-metrics.md).
# Evaluation Metrics
## **A metric learning reality check**
1. [**Medium**](https://medium.com/@tkm45/updates-to-a-metric-learning-reality-check-730b6914dfe7)
2. [**Git**](https://github.com/KevinMusgrave/pytorch-metric-learning?fbclid=IwAR3PmPTDgYFok4p095WmkRWLfWhixyjFXkZgFJzeYXs5Y92pofoNZL_lGTg)
3. [**Website**](https://kevinmusgrave.github.io/powerful-benchmarker/papers/mlrc/?fbclid=IwAR3jK3-qFphFsO7ocmjeN-zPLkcaQkTAcC78cFUNFVe1BgXzM-iE5PLh3bU)
## **SUPERVISED**
### Accuracy
1. accuracy
### Perplexity
1. [perplexity and accuracy in classification](https://medium.com/unpackai/perplexity-and-accuracy-in-classification-114b57bd820d)
2.
### **Precision \ Recall \ ROC \ AUC**
**-** [**Performance Measures**](http://machinelearningmastery.com/classification-accuracy-is-not-enough-more-performance-measures-you-can-use/)**:**
**A balanced confusion matrix is better than one that is either one row of numbers and one of zeros, or a column of numbers and a column of zeros. Therefore an algorithm that outputs a lower classification accuracy but has a better confusion matrix wins.**
**# of Positive predictions divided by the total number of positive class values predicted.**
**Precision = True Positives / (True Positives + False Positives)**
**Low can be thought of many false positives.**
**# of positive predictions divided by the number of positive class values in the test data**
**Recall (sensitivity) = True Positives / (True Positives + False Negatives)**
**Low can be thought of many false negatives.**
#### **F1 Harmonic Mean Score**
**F1\_Score = 2 \* ((Precision \* Recall) / (Precision + Recall))**
**F1 helps select a model based on a balance between precision and recall.**
**In a multi-class problem, there are many methods to calculate F1, some are more appropriate for balanced data, others are not.**
1. [**The best link yet**](https://simonhessner.de/why-are-precision-recall-and-f1-score-equal-when-using-micro-averaging-in-a-multi-class-problem/) **- micro macro weighted (macro balanced, micro imbalanced, weighted imbalanced)**
2. [**Micro vs macro** ](https://datascience.stackexchange.com/questions/15989/micro-average-vs-macro-average-performance-in-a-multiclass-classification-settin/16001)
3. [**Micro vs weighted (not a good link**](https://stats.stackexchange.com/questions/169439/micro-vs-weighted-f1-score)**)**
4. [**What is weighted**](https://stats.stackexchange.com/questions/283961/where-does-sklearns-weighted-f1-score-come-from)
5. [**Micro is accuracy**](https://stackoverflow.com/questions/37358496/is-f1-micro-the-same-as-accuracy) **in multi class**
**------------------------------------**
* **Accuracy = (1 – Error) = (TP + TN)/(PP + NP) = Pr(C), the probability of a correct classification.**
* **Sensitivity (recall) = TP/(TP + FN) = TP/PP = the ability of the test to detect disease in a population of diseased individuals.**
* **Specificity = TN/(TN + FP) = TN / NP = the ability of the test to correctly rule out the disease in a disease-free population.**
**(**[**What are ?)**](http://machinelearningmastery.com/assessing-comparing-classifier-performance-roc-curves-2/) **Sensitivity and specificity against ROC and AUC.**
[**ROC curve and AUC in weka**](https://www.youtube.com/watch?v=j97h_-b0gvw\&list=PLJbE6j2EG1pZnBhOg3_Rb63WLCprtyJag) **- explains how the curve should look like for the negative or positive predictions, against what is actually plotted.**
**Mean F1?** [**How**](https://datascience.stackexchange.com/questions/16179/what-is-the-correct-way-to-compute-mean-f1-score) **do we calculate** [**it**](http://rushdishams.blogspot.com/2011/08/micro-and-macro-average-of-precision.html)**.**
[**Multiclass Precision / Recall**](https://towardsdatascience.com/multi-class-metrics-made-simple-part-ii-the-f1-score-ebe8b2c2ca1)**,** [**part 1**](https://towardsdatascience.com/multi-class-metrics-made-simple-part-i-precision-and-recall-9250280bddc2)
[**Precision at K**](https://medium.com/@m_n_malaeb/recall-and-precision-at-k-for-recommender-systems-618483226c54)**,** [**formulas, examples**](https://surprise.readthedocs.io/en/latest/FAQ.html#how-to-compute-precision-k-and-recall-k)**,** [**git 1**](https://github.com/scikit-learn/scikit-learn/pull/14859)**,** [**git 2**](https://gist.github.com/mblondel/7337391)**,** [**git 3**](https://github.com/scikit-learn/scikit-learn/issues/7343) **(suggestive, recommendation application)**
#### **RECALL, PRECISION AND F1**
1. [**Medium on Controling the decision threshold using the probabilities any model gives, code, samples, tutorial**](https://towardsdatascience.com/fine-tuning-a-classifier-in-scikit-learn-66e048c21e65)
2. [**Another good medium explanation on precision / recall / fpr/ tpr etc**](https://towardsdatascience.com/beyond-accuracy-precision-and-recall-3da06bea9f6c)
3. [**Scikit lego on choosing the threshold using grid search**](https://scikit-lego.readthedocs.io/en/latest/meta.html#Thresholder)
4. [**Best explanation ever** ](https://www.quora.com/What-is-the-best-way-to-understand-the-terms-precision-and-recall)
**Recall**
* **one day, your girlfriend asks you: ‘Sweetie, do you remember all birthday surprises from me?’**
* **This simple question makes your life in danger. To extend your life, you need to recall all 10 surprising events from your memory.**
* **So, recall is the ratio of a number of events you can correctly recall to a number of all correct events. If you can recall all 10 events correctly, then, your recall ratio is 1.0 (100%). If you can recall 7 events correctly, your recall ratio is 0.7 (70%).**
**Precision**
* **For example, you answers 15 times, 10 events are correct and 5 events are wrong. This means you can recall all events but it’s not so precise.**
* **So, precision is the ratio of a number of events you can correctly recall to a number all events you recall (mix of correct and wrong recalls). In other words, it is how precise of your recall.**
* **From the previous example (10 real events, 15 answers: 10 correct answers, 5 wrong answers), you get 100% recall but your precision is only 66.67% (10 / 15).**
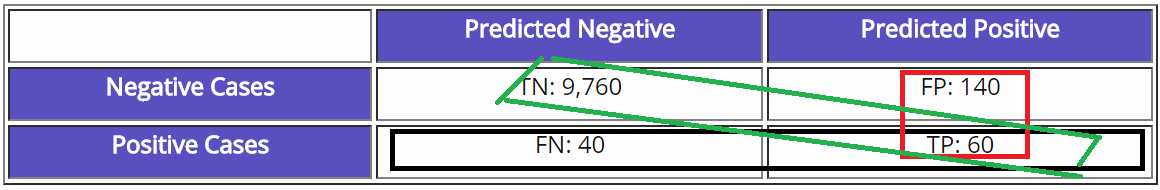
[**Confusion matrix wise**](http://www.kdnuggets.com/faq/precision-recall.html)**: bottom line is recall (% correct out of positive cases), right column is precision (% of POS predictions) & % accuracy in diagonal**
[**F1 score**](http://machinelearningmastery.com/classification-accuracy-is-not-enough-more-performance-measures-you-can-use/)**:**
* **conveys the balance between the precision and the recall**
* **2\*((precision\*recall)/(precision+recall)**
[**Yet another(pretty good) source**](http://blog.exsilio.com/all/accuracy-precision-recall-f1-score-interpretation-of-performance-measures/)
[**Another (bad) source**](https://chrisalbon.com/machine-learning/precision_recall_and_F1_scores.html) **for explaining, precision, recall, accuracy, true positive rate etc.**
**(How to use precision and recall?) answer by aurelien geron:**
* **In a binary classifier, the decision function is the function that produces a score for the positive class.**
* **In a logistic regression classifier, that decision function is simply a linear combination of the input features.**
* **If that score is greater than some threshold that you choose, then the classifier "predicts" the positive class, or else it predicts the negative class.**
* **If you want your model to have high precision (at the cost of a low recall), then you must set the threshold pretty high. This way, the model will only predict the positive class when it is absolutely certain. For example, you may want this if the classifier is selecting videos that are safe for kids: it's better to err on the safe side.**
* **Conversely, if you want high recall (at the cost of a low precision) then you must use a low threshold. For example, if the classifier is used to detect intruders in a nuclear plant, then you probably want to detect all actual intruders, even if it means getting a lot of false alarms (called "false positives").**
* **If you make a few assumptions about the distribution of the data (i.e., the positive and negative class are separated by a linear boundary plus Gaussian noise), then computing the logistic of the score gives you the probability that the instance belongs to the positive class. A score of 0 corresponds to the 50% probability. So by default, a LogisticClassifier predicts the positive class if it estimates the probability to be greater than 50%. In general, this sounds like a reasonable default threshold, but really it all depends on what you want to do with the classifier.**
* **If the assumptions I mentioned above were perfect, then if the Logistic Classifier outputs a probability of X% for an instance, it means there is exactly X% chance that it's positive. But in practice, the assumptions are imperfect, so I try to always make it clear that we are talking about an "estimated probability", not an actual probability.**
#### **ROC CURVES**
1. [**Diff between precision recall to roc curve**](https://www.quora.com/What-is-the-difference-between-a-ROC-curve-and-a-precision-recall-curve-When-should-I-use-each)
2. [**What is ROC AUC and PR AUC and when to use then (i.e for imbalanced data use PRAUC)**](http://www.chioka.in/differences-between-roc-auc-and-pr-auc/)
3. [**What is AUC (AUROC)**](https://stats.stackexchange.com/questions/132777/what-does-auc-stand-for-and-what-is-it)
[**(RMSE - what is?)**](https://stats.stackexchange.com/questions/56302/what-are-good-rmse-values) **- it is important to recall that RMSE has the same unit as the dependent variable (DV). It means that there is no absolute good or bad threshold, however you can define it based on your DV. For a datum which ranges from 0 to 1000, an RMSE of 0.7 is small, but if the range goes from 0 to 1, it is not that small anymore. However, although the smaller the RMSE, the better,**
[**(R^2 vs RMSE)**](https://stats.stackexchange.com/questions/142248/difference-between-r-square-and-rmse-in-linear-regression) **- R-squared is conveniently scaled between 0 and 1, whereas RMSE is not scaled to any particular values. This can be good or bad; obviously R-squared can be more easily interpreted, but with RMSE we explicitly know how much our predictions deviate, on average, from the actual values in the dataset. So in a way, RMSE tells you more.**
**I also found this** [**video**](https://www.youtube.com/watch?v=aq8VU5KLmkY) **really helpful.**
[**Kappa**](https://stats.stackexchange.com/questions/82162/cohens-kappa-in-plain-english) **- measures accuracy while considering imbalanced datasets**
**References:**
1. [**A Survey on Deep Learning in Medical Image Analysis**](https://arxiv.org/abs/1702.05747)
### **UNSUPERVISED**
1. [**Silhouette Analysis vs Elbow Method vs Davies-Bouldin Index: Selecting the optimal number of clusters for KMeans clustering**](https://gdcoder.com/silhouette-analysis-vs-elbow-method-vs-davies-bouldin-index-selecting-the-optimal-number-of-clusters-for-kmeans-clustering/)
2.
##
---
# Agent Instructions
This documentation is published with GitBook. GitBook is the documentation platform designed so that both humans and AI agents can read, navigate, and reason over technical content effectively. Learn more at gitbook.com.
## Querying This Documentation
If you need additional information that is not directly available in this page, you can query the documentation dynamically by asking a question.
Perform an HTTP GET request on the current page URL with the `ask` query parameter, and the optional `goal` query parameter:
```
GET https://www.mlcompendium.com/validation-and-evaluation/evaluation-metrics.md?ask=&goal=
```
`ask` is the immediate question: it should be specific, self-contained, and written in natural language.
`goal` is optional and describes the broader end goal you are ultimately trying to accomplish on behalf of the user. GitBook uses it to tailor the answer towards what is most useful for that goal.
The response will contain a direct answer to the question and relevant excerpts and sources from the documentation.
Use this mechanism when the answer is not explicitly present in the current page, you need clarification or additional context, or you want to retrieve related documentation sections.